Subsaharan African vs Cajun Median Family Income
COMPARE
Subsaharan African
Cajun
Median Family Income
Median Family Income Comparison
Sub-Saharan Africans
Cajuns
$93,748
MEDIAN FAMILY INCOME
1.0/ 100
METRIC RATING
244th/ 347
METRIC RANK
$87,157
MEDIAN FAMILY INCOME
0.0/ 100
METRIC RATING
297th/ 347
METRIC RANK
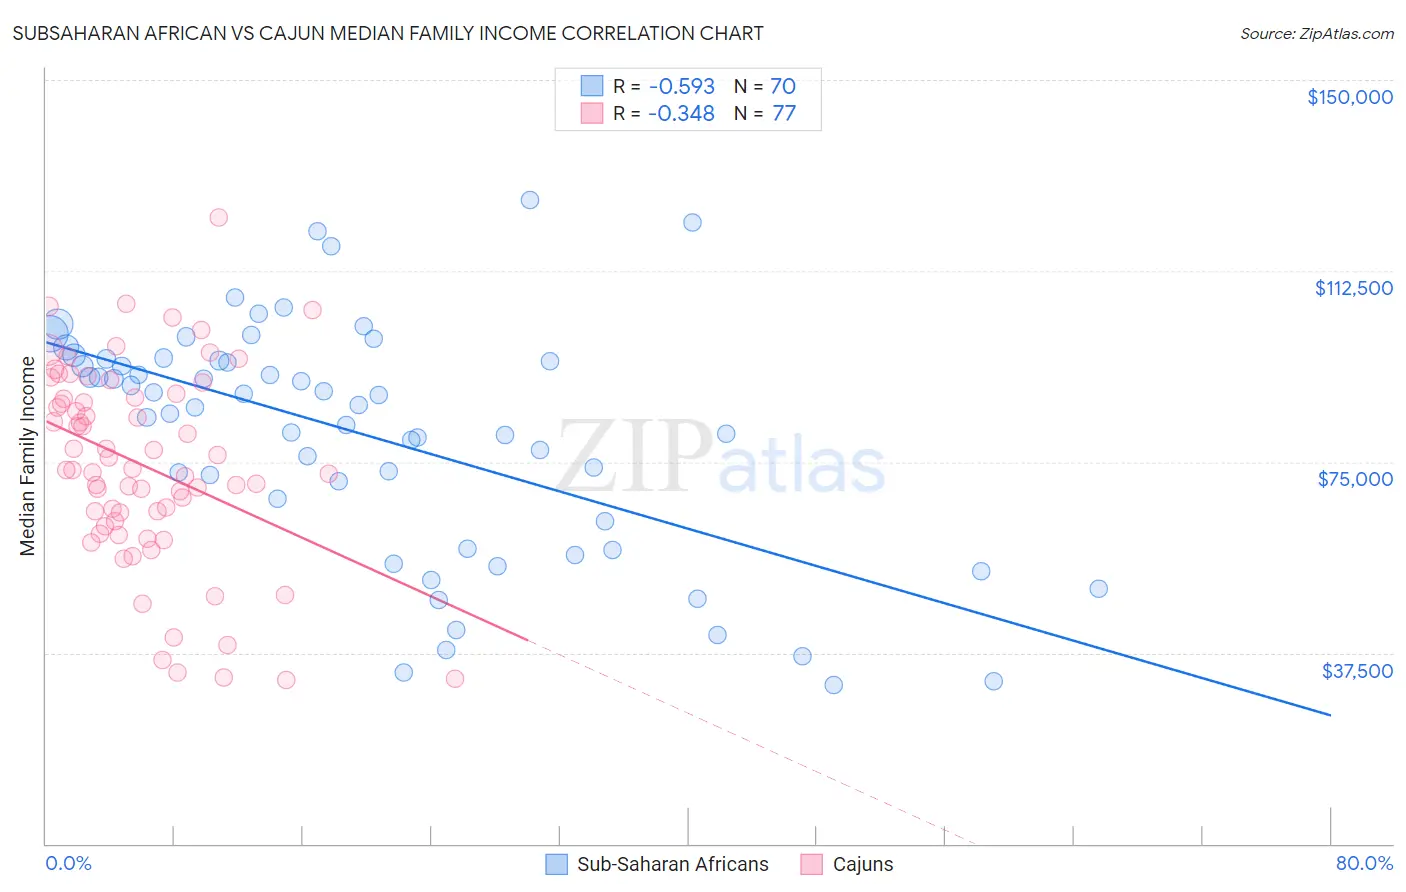
Subsaharan African vs Cajun Median Family Income Correlation Chart
The statistical analysis conducted on geographies consisting of 507,233,451 people shows a substantial negative correlation between the proportion of Sub-Saharan Africans and median family income in the United States with a correlation coefficient (R) of -0.593 and weighted average of $93,748. Similarly, the statistical analysis conducted on geographies consisting of 149,670,371 people shows a mild negative correlation between the proportion of Cajuns and median family income in the United States with a correlation coefficient (R) of -0.348 and weighted average of $87,157, a difference of 7.6%.
Median Family Income Correlation Summary
| Measurement | Subsaharan African | Cajun |
| Minimum | $31,084 | $32,222 |
| Maximum | $126,507 | $122,896 |
| Range | $95,423 | $90,674 |
| Mean | $80,060 | $74,286 |
| Median | $85,890 | $73,392 |
| Interquartile 25% (IQ1) | $63,281 | $62,875 |
| Interquartile 75% (IQ3) | $94,886 | $88,056 |
| Interquartile Range (IQR) | $31,605 | $25,181 |
| Standard Deviation (Sample) | $22,942 | $19,414 |
| Standard Deviation (Population) | $22,778 | $19,288 |
Similar Demographics by Median Family Income
Demographics Similar to Sub-Saharan Africans by Median Family Income
In terms of median family income, the demographic groups most similar to Sub-Saharan Africans are German Russian ($93,858, a difference of 0.12%), Immigrants from Middle Africa ($93,593, a difference of 0.17%), Barbadian ($93,919, a difference of 0.18%), Immigrants from Trinidad and Tobago ($93,988, a difference of 0.26%), and Somali ($94,085, a difference of 0.36%).
| Demographics | Rating | Rank | Median Family Income |
| Alaskan Athabascans | 1.5 /100 | #237 | Tragic $94,429 |
| Nepalese | 1.3 /100 | #238 | Tragic $94,153 |
| Salvadorans | 1.2 /100 | #239 | Tragic $94,109 |
| Somalis | 1.2 /100 | #240 | Tragic $94,085 |
| Immigrants | Trinidad and Tobago | 1.2 /100 | #241 | Tragic $93,988 |
| Barbadians | 1.1 /100 | #242 | Tragic $93,919 |
| German Russians | 1.1 /100 | #243 | Tragic $93,858 |
| Sub-Saharan Africans | 1.0 /100 | #244 | Tragic $93,748 |
| Immigrants | Middle Africa | 1.0 /100 | #245 | Tragic $93,593 |
| Guyanese | 0.9 /100 | #246 | Tragic $93,373 |
| Immigrants | Senegal | 0.7 /100 | #247 | Tragic $92,912 |
| French American Indians | 0.7 /100 | #248 | Tragic $92,872 |
| Immigrants | Ecuador | 0.7 /100 | #249 | Tragic $92,837 |
| West Indians | 0.6 /100 | #250 | Tragic $92,765 |
| Immigrants | Somalia | 0.6 /100 | #251 | Tragic $92,609 |
Demographics Similar to Cajuns by Median Family Income
In terms of median family income, the demographic groups most similar to Cajuns are Immigrants from Guatemala ($87,191, a difference of 0.040%), Yaqui ($87,289, a difference of 0.15%), Immigrants from Latin America ($86,989, a difference of 0.19%), Fijian ($87,387, a difference of 0.26%), and Chippewa ($86,852, a difference of 0.35%).
| Demographics | Rating | Rank | Median Family Income |
| Shoshone | 0.1 /100 | #290 | Tragic $87,872 |
| Immigrants | Cabo Verde | 0.1 /100 | #291 | Tragic $87,830 |
| Africans | 0.1 /100 | #292 | Tragic $87,820 |
| Ute | 0.0 /100 | #293 | Tragic $87,596 |
| Fijians | 0.0 /100 | #294 | Tragic $87,387 |
| Yaqui | 0.0 /100 | #295 | Tragic $87,289 |
| Immigrants | Guatemala | 0.0 /100 | #296 | Tragic $87,191 |
| Cajuns | 0.0 /100 | #297 | Tragic $87,157 |
| Immigrants | Latin America | 0.0 /100 | #298 | Tragic $86,989 |
| Chippewa | 0.0 /100 | #299 | Tragic $86,852 |
| Ottawa | 0.0 /100 | #300 | Tragic $86,380 |
| Colville | 0.0 /100 | #301 | Tragic $85,792 |
| Spanish American Indians | 0.0 /100 | #302 | Tragic $85,728 |
| Hispanics or Latinos | 0.0 /100 | #303 | Tragic $85,647 |
| Mexicans | 0.0 /100 | #304 | Tragic $85,618 |