Iraqi vs Iroquois Householder Income Over 65 years
COMPARE
Iraqi
Iroquois
Householder Income Over 65 years
Householder Income Over 65 years Comparison
Iraqis
Iroquois
$60,466
HOUSEHOLDER INCOME OVER 65 YEARS
37.2/ 100
METRIC RATING
184th/ 347
METRIC RANK
$53,737
HOUSEHOLDER INCOME OVER 65 YEARS
0.1/ 100
METRIC RATING
289th/ 347
METRIC RANK
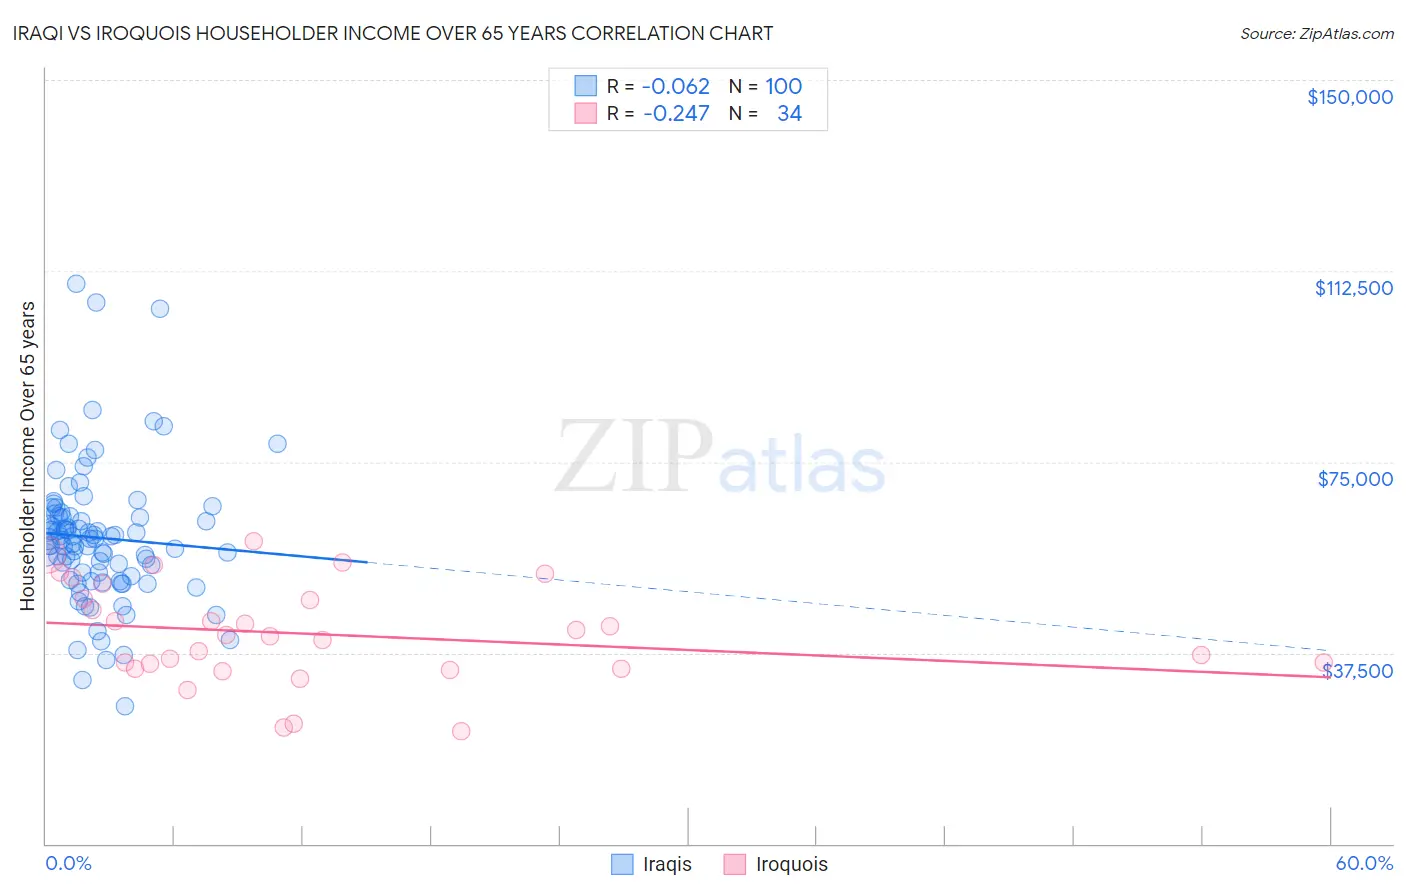
Iraqi vs Iroquois Householder Income Over 65 years Correlation Chart
The statistical analysis conducted on geographies consisting of 170,476,894 people shows a slight negative correlation between the proportion of Iraqis and household income with householder over the age of 65 in the United States with a correlation coefficient (R) of -0.062 and weighted average of $60,466. Similarly, the statistical analysis conducted on geographies consisting of 206,830,612 people shows a weak negative correlation between the proportion of Iroquois and household income with householder over the age of 65 in the United States with a correlation coefficient (R) of -0.247 and weighted average of $53,737, a difference of 12.5%.
Householder Income Over 65 years Correlation Summary
| Measurement | Iraqi | Iroquois |
| Minimum | $27,083 | $22,212 |
| Maximum | $110,088 | $59,317 |
| Range | $83,005 | $37,105 |
| Mean | $60,115 | $41,171 |
| Median | $59,854 | $40,975 |
| Interquartile 25% (IQ1) | $52,888 | $34,309 |
| Interquartile 75% (IQ3) | $64,237 | $48,128 |
| Interquartile Range (IQR) | $11,349 | $13,819 |
| Standard Deviation (Sample) | $13,499 | $9,770 |
| Standard Deviation (Population) | $13,432 | $9,625 |
Similar Demographics by Householder Income Over 65 years
Demographics Similar to Iraqis by Householder Income Over 65 years
In terms of householder income over 65 years, the demographic groups most similar to Iraqis are Kenyan ($60,514, a difference of 0.080%), Czechoslovakian ($60,581, a difference of 0.19%), Celtic ($60,608, a difference of 0.23%), Immigrants from Morocco ($60,647, a difference of 0.30%), and Welsh ($60,666, a difference of 0.33%).
| Demographics | Rating | Rank | Householder Income Over 65 years |
| Alaska Natives | 44.3 /100 | #177 | Average $60,748 |
| Yup'ik | 43.7 /100 | #178 | Average $60,727 |
| Welsh | 42.2 /100 | #179 | Average $60,666 |
| Immigrants | Morocco | 41.7 /100 | #180 | Average $60,647 |
| Celtics | 40.7 /100 | #181 | Average $60,608 |
| Czechoslovakians | 40.0 /100 | #182 | Average $60,581 |
| Kenyans | 38.4 /100 | #183 | Fair $60,514 |
| Iraqis | 37.2 /100 | #184 | Fair $60,466 |
| Albanians | 32.0 /100 | #185 | Fair $60,249 |
| Slovenes | 31.8 /100 | #186 | Fair $60,241 |
| Immigrants | Thailand | 31.3 /100 | #187 | Fair $60,217 |
| Immigrants | Eritrea | 28.6 /100 | #188 | Fair $60,096 |
| Ghanaians | 27.5 /100 | #189 | Fair $60,043 |
| Puget Sound Salish | 25.3 /100 | #190 | Fair $59,934 |
| Belgians | 24.9 /100 | #191 | Fair $59,915 |
Demographics Similar to Iroquois by Householder Income Over 65 years
In terms of householder income over 65 years, the demographic groups most similar to Iroquois are Chickasaw ($53,732, a difference of 0.010%), Immigrants from Barbados ($53,766, a difference of 0.050%), Paiute ($53,762, a difference of 0.050%), African ($53,711, a difference of 0.050%), and Shoshone ($53,681, a difference of 0.10%).
| Demographics | Rating | Rank | Householder Income Over 65 years |
| Immigrants | Armenia | 0.1 /100 | #282 | Tragic $53,974 |
| Immigrants | Liberia | 0.1 /100 | #283 | Tragic $53,967 |
| Immigrants | Guatemala | 0.1 /100 | #284 | Tragic $53,950 |
| Mexicans | 0.1 /100 | #285 | Tragic $53,897 |
| Chippewa | 0.1 /100 | #286 | Tragic $53,847 |
| Immigrants | Barbados | 0.1 /100 | #287 | Tragic $53,766 |
| Paiute | 0.1 /100 | #288 | Tragic $53,762 |
| Iroquois | 0.1 /100 | #289 | Tragic $53,737 |
| Chickasaw | 0.1 /100 | #290 | Tragic $53,732 |
| Africans | 0.0 /100 | #291 | Tragic $53,711 |
| Shoshone | 0.0 /100 | #292 | Tragic $53,681 |
| Immigrants | Belize | 0.0 /100 | #293 | Tragic $53,665 |
| Senegalese | 0.0 /100 | #294 | Tragic $53,591 |
| Immigrants | Central America | 0.0 /100 | #295 | Tragic $53,420 |
| Immigrants | Somalia | 0.0 /100 | #296 | Tragic $53,333 |