Korean vs Immigrants from Liberia Median Family Income
COMPARE
Korean
Immigrants from Liberia
Median Family Income
Median Family Income Comparison
Koreans
Immigrants from Liberia
$110,103
MEDIAN FAMILY INCOME
97.8/ 100
METRIC RATING
94th/ 347
METRIC RANK
$90,450
MEDIAN FAMILY INCOME
0.2/ 100
METRIC RATING
272nd/ 347
METRIC RANK
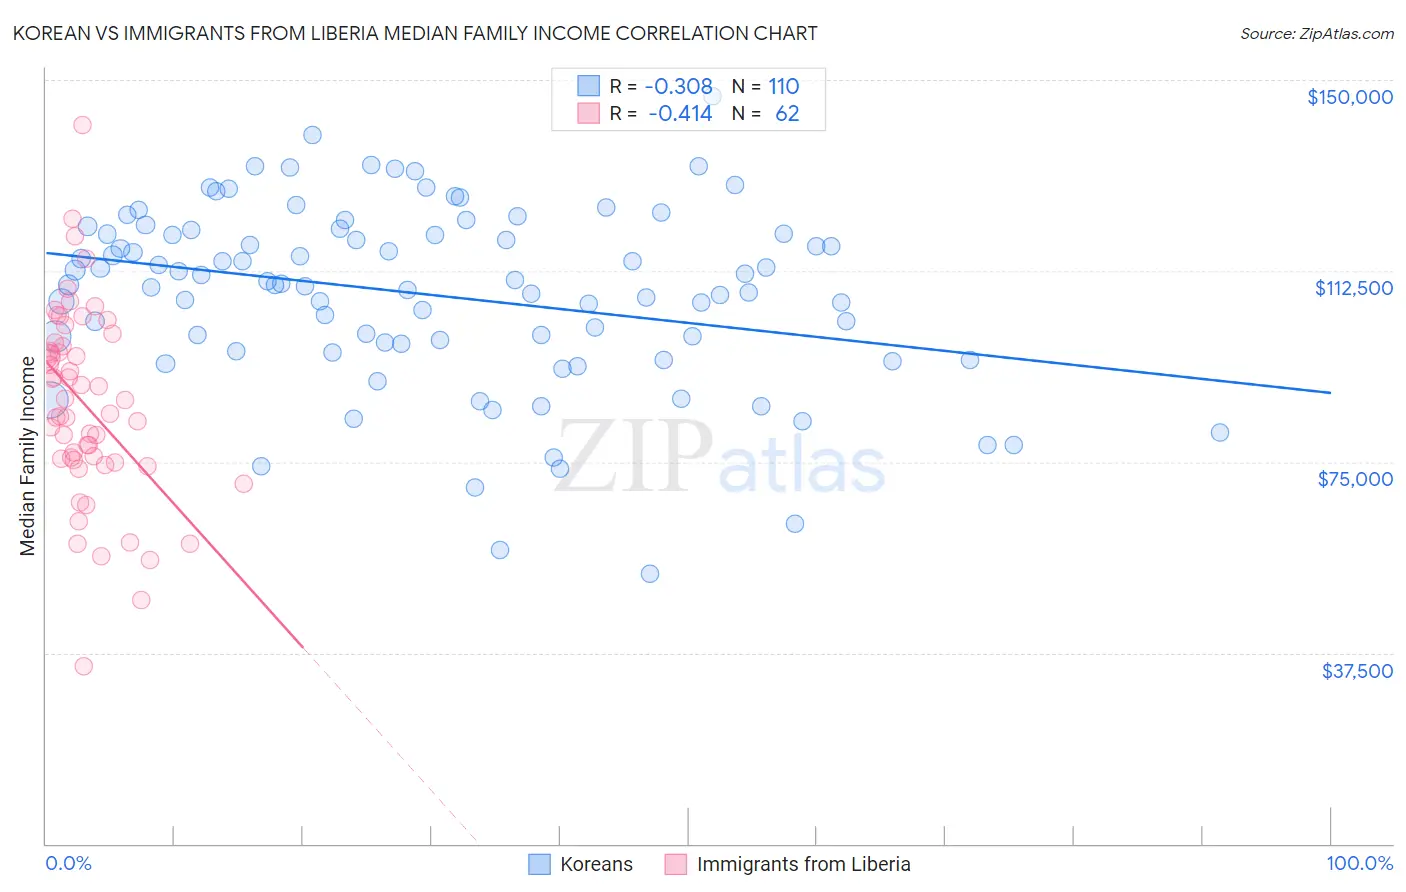
Korean vs Immigrants from Liberia Median Family Income Correlation Chart
The statistical analysis conducted on geographies consisting of 510,104,547 people shows a mild negative correlation between the proportion of Koreans and median family income in the United States with a correlation coefficient (R) of -0.308 and weighted average of $110,103. Similarly, the statistical analysis conducted on geographies consisting of 135,228,267 people shows a moderate negative correlation between the proportion of Immigrants from Liberia and median family income in the United States with a correlation coefficient (R) of -0.414 and weighted average of $90,450, a difference of 21.7%.
Median Family Income Correlation Summary
| Measurement | Korean | Immigrants from Liberia |
| Minimum | $53,031 | $34,978 |
| Maximum | $146,906 | $141,080 |
| Range | $93,875 | $106,102 |
| Mean | $107,726 | $86,151 |
| Median | $109,878 | $85,817 |
| Interquartile 25% (IQ1) | $98,078 | $75,284 |
| Interquartile 75% (IQ3) | $119,779 | $97,769 |
| Interquartile Range (IQR) | $21,701 | $22,485 |
| Standard Deviation (Sample) | $17,855 | $18,837 |
| Standard Deviation (Population) | $17,774 | $18,685 |
Similar Demographics by Median Family Income
Demographics Similar to Koreans by Median Family Income
In terms of median family income, the demographic groups most similar to Koreans are Immigrants from Kazakhstan ($110,137, a difference of 0.030%), Immigrants from Lebanon ($110,159, a difference of 0.050%), Zimbabwean ($110,011, a difference of 0.080%), Immigrants from Moldova ($109,975, a difference of 0.12%), and Jordanian ($109,865, a difference of 0.22%).
| Demographics | Rating | Rank | Median Family Income |
| Austrians | 98.8 /100 | #87 | Exceptional $111,306 |
| Romanians | 98.8 /100 | #88 | Exceptional $111,243 |
| Immigrants | Argentina | 98.5 /100 | #89 | Exceptional $110,873 |
| Northern Europeans | 98.3 /100 | #90 | Exceptional $110,635 |
| Immigrants | Southern Europe | 98.3 /100 | #91 | Exceptional $110,614 |
| Immigrants | Lebanon | 97.9 /100 | #92 | Exceptional $110,159 |
| Immigrants | Kazakhstan | 97.8 /100 | #93 | Exceptional $110,137 |
| Koreans | 97.8 /100 | #94 | Exceptional $110,103 |
| Zimbabweans | 97.7 /100 | #95 | Exceptional $110,011 |
| Immigrants | Moldova | 97.7 /100 | #96 | Exceptional $109,975 |
| Jordanians | 97.5 /100 | #97 | Exceptional $109,865 |
| Immigrants | Kuwait | 97.4 /100 | #98 | Exceptional $109,731 |
| Armenians | 97.3 /100 | #99 | Exceptional $109,692 |
| Macedonians | 97.3 /100 | #100 | Exceptional $109,668 |
| Immigrants | Ukraine | 97.2 /100 | #101 | Exceptional $109,645 |
Demographics Similar to Immigrants from Liberia by Median Family Income
In terms of median family income, the demographic groups most similar to Immigrants from Liberia are Iroquois ($90,543, a difference of 0.10%), Immigrants from Micronesia ($90,345, a difference of 0.12%), Jamaican ($90,581, a difference of 0.14%), Spanish American ($90,322, a difference of 0.14%), and Immigrants from St. Vincent and the Grenadines ($90,094, a difference of 0.40%).
| Demographics | Rating | Rank | Median Family Income |
| Hmong | 0.3 /100 | #265 | Tragic $91,296 |
| Central Americans | 0.3 /100 | #266 | Tragic $91,087 |
| Mexican American Indians | 0.2 /100 | #267 | Tragic $90,918 |
| Cree | 0.2 /100 | #268 | Tragic $90,882 |
| Belizeans | 0.2 /100 | #269 | Tragic $90,880 |
| Jamaicans | 0.2 /100 | #270 | Tragic $90,581 |
| Iroquois | 0.2 /100 | #271 | Tragic $90,543 |
| Immigrants | Liberia | 0.2 /100 | #272 | Tragic $90,450 |
| Immigrants | Micronesia | 0.2 /100 | #273 | Tragic $90,345 |
| Spanish Americans | 0.2 /100 | #274 | Tragic $90,322 |
| Immigrants | St. Vincent and the Grenadines | 0.2 /100 | #275 | Tragic $90,094 |
| Immigrants | Zaire | 0.1 /100 | #276 | Tragic $89,285 |
| Immigrants | Jamaica | 0.1 /100 | #277 | Tragic $89,268 |
| Immigrants | Grenada | 0.1 /100 | #278 | Tragic $89,249 |
| Immigrants | Belize | 0.1 /100 | #279 | Tragic $89,197 |