Iraqi vs Immigrants from Japan Median Female Earnings
COMPARE
Iraqi
Immigrants from Japan
Median Female Earnings
Median Female Earnings Comparison
Iraqis
Immigrants from Japan
$38,666
MEDIAN FEMALE EARNINGS
10.5/ 100
METRIC RATING
214th/ 347
METRIC RANK
$45,323
MEDIAN FEMALE EARNINGS
100.0/ 100
METRIC RATING
20th/ 347
METRIC RANK
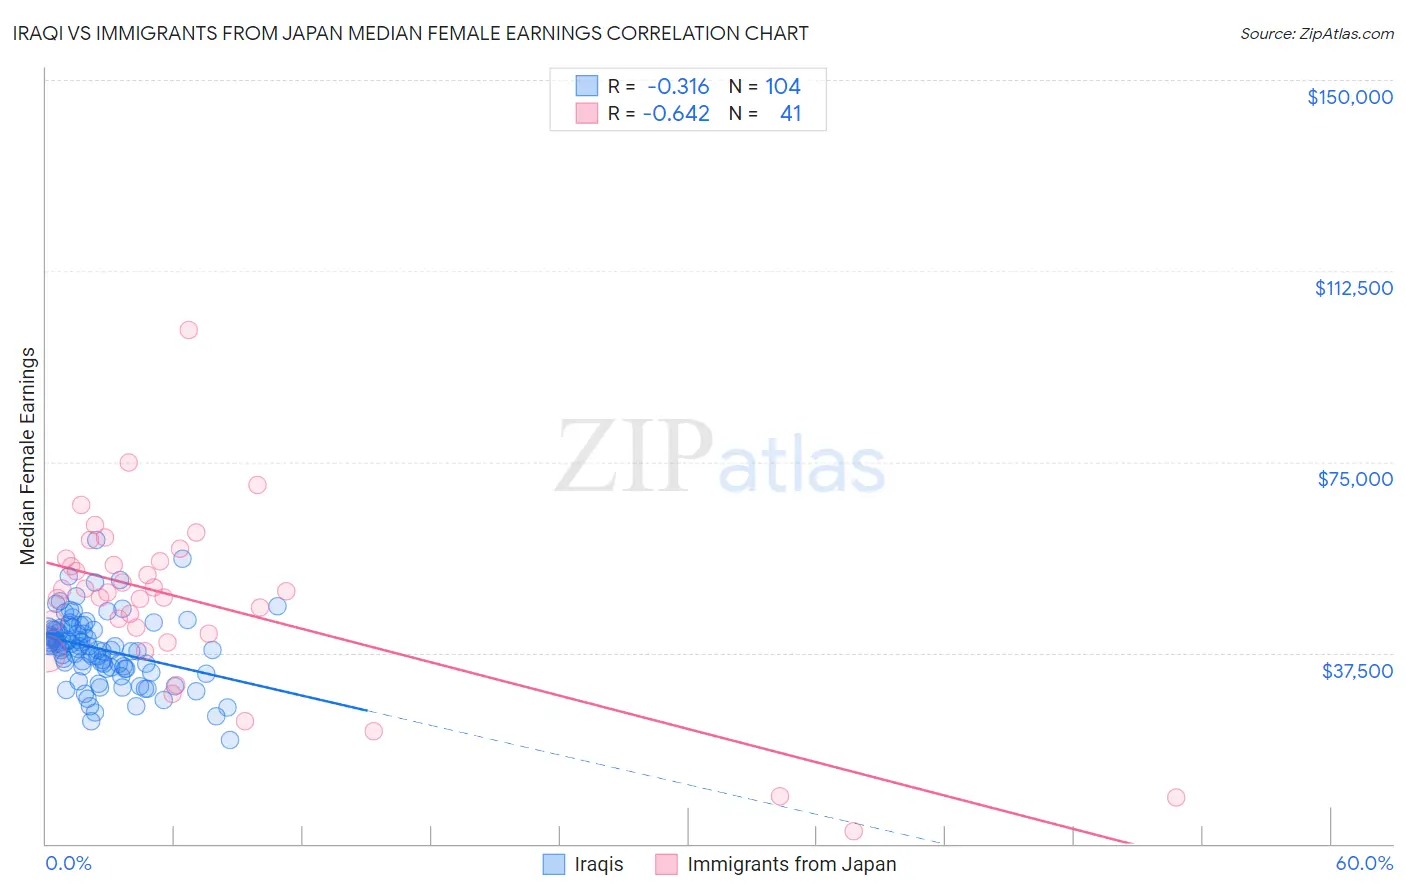
Iraqi vs Immigrants from Japan Median Female Earnings Correlation Chart
The statistical analysis conducted on geographies consisting of 170,627,853 people shows a mild negative correlation between the proportion of Iraqis and median female earnings in the United States with a correlation coefficient (R) of -0.316 and weighted average of $38,666. Similarly, the statistical analysis conducted on geographies consisting of 340,067,986 people shows a significant negative correlation between the proportion of Immigrants from Japan and median female earnings in the United States with a correlation coefficient (R) of -0.642 and weighted average of $45,323, a difference of 17.2%.
Median Female Earnings Correlation Summary
| Measurement | Iraqi | Immigrants from Japan |
| Minimum | $20,406 | $2,499 |
| Maximum | $59,566 | $100,821 |
| Range | $39,160 | $98,322 |
| Mean | $38,287 | $47,310 |
| Median | $38,841 | $49,462 |
| Interquartile 25% (IQ1) | $34,526 | $40,316 |
| Interquartile 75% (IQ3) | $42,153 | $55,693 |
| Interquartile Range (IQR) | $7,626 | $15,376 |
| Standard Deviation (Sample) | $6,723 | $17,852 |
| Standard Deviation (Population) | $6,691 | $17,633 |
Similar Demographics by Median Female Earnings
Demographics Similar to Iraqis by Median Female Earnings
In terms of median female earnings, the demographic groups most similar to Iraqis are Jamaican ($38,670, a difference of 0.010%), Spaniard ($38,656, a difference of 0.020%), Immigrants from Ecuador ($38,644, a difference of 0.060%), Immigrants from Jamaica ($38,625, a difference of 0.11%), and Guamanian/Chamorro ($38,717, a difference of 0.13%).
| Demographics | Rating | Rank | Median Female Earnings |
| Immigrants | Cambodia | 14.2 /100 | #207 | Poor $38,833 |
| Immigrants | Thailand | 13.6 /100 | #208 | Poor $38,810 |
| Norwegians | 13.4 /100 | #209 | Poor $38,802 |
| Czechoslovakians | 12.0 /100 | #210 | Poor $38,738 |
| Aleuts | 11.6 /100 | #211 | Poor $38,719 |
| Guamanians/Chamorros | 11.5 /100 | #212 | Poor $38,717 |
| Jamaicans | 10.5 /100 | #213 | Poor $38,670 |
| Iraqis | 10.5 /100 | #214 | Poor $38,666 |
| Spaniards | 10.3 /100 | #215 | Poor $38,656 |
| Immigrants | Ecuador | 10.1 /100 | #216 | Poor $38,644 |
| Immigrants | Jamaica | 9.7 /100 | #217 | Tragic $38,625 |
| Cape Verdeans | 9.5 /100 | #218 | Tragic $38,614 |
| Nepalese | 9.3 /100 | #219 | Tragic $38,603 |
| Yugoslavians | 8.8 /100 | #220 | Tragic $38,573 |
| Immigrants | Azores | 8.8 /100 | #221 | Tragic $38,573 |
Demographics Similar to Immigrants from Japan by Median Female Earnings
In terms of median female earnings, the demographic groups most similar to Immigrants from Japan are Eastern European ($45,385, a difference of 0.14%), Cypriot ($45,570, a difference of 0.55%), Cambodian ($45,014, a difference of 0.69%), Immigrants from Greece ($44,976, a difference of 0.77%), and Burmese ($44,911, a difference of 0.92%).
| Demographics | Rating | Rank | Median Female Earnings |
| Immigrants | Australia | 100.0 /100 | #13 | Exceptional $46,573 |
| Soviet Union | 100.0 /100 | #14 | Exceptional $46,556 |
| Immigrants | Eastern Asia | 100.0 /100 | #15 | Exceptional $46,502 |
| Indians (Asian) | 100.0 /100 | #16 | Exceptional $46,481 |
| Immigrants | South Central Asia | 100.0 /100 | #17 | Exceptional $46,324 |
| Cypriots | 100.0 /100 | #18 | Exceptional $45,570 |
| Eastern Europeans | 100.0 /100 | #19 | Exceptional $45,385 |
| Immigrants | Japan | 100.0 /100 | #20 | Exceptional $45,323 |
| Cambodians | 100.0 /100 | #21 | Exceptional $45,014 |
| Immigrants | Greece | 100.0 /100 | #22 | Exceptional $44,976 |
| Burmese | 100.0 /100 | #23 | Exceptional $44,911 |
| Immigrants | Korea | 100.0 /100 | #24 | Exceptional $44,847 |
| Immigrants | Sweden | 100.0 /100 | #25 | Exceptional $44,774 |
| Immigrants | Belarus | 100.0 /100 | #26 | Exceptional $44,757 |
| Turks | 100.0 /100 | #27 | Exceptional $44,695 |