Subsaharan African vs Immigrants from Japan Per Capita Income
COMPARE
Subsaharan African
Immigrants from Japan
Per Capita Income
Per Capita Income Comparison
Sub-Saharan Africans
Immigrants from Japan
$40,152
PER CAPITA INCOME
1.9/ 100
METRIC RATING
245th/ 347
METRIC RANK
$53,359
PER CAPITA INCOME
100.0/ 100
METRIC RATING
25th/ 347
METRIC RANK
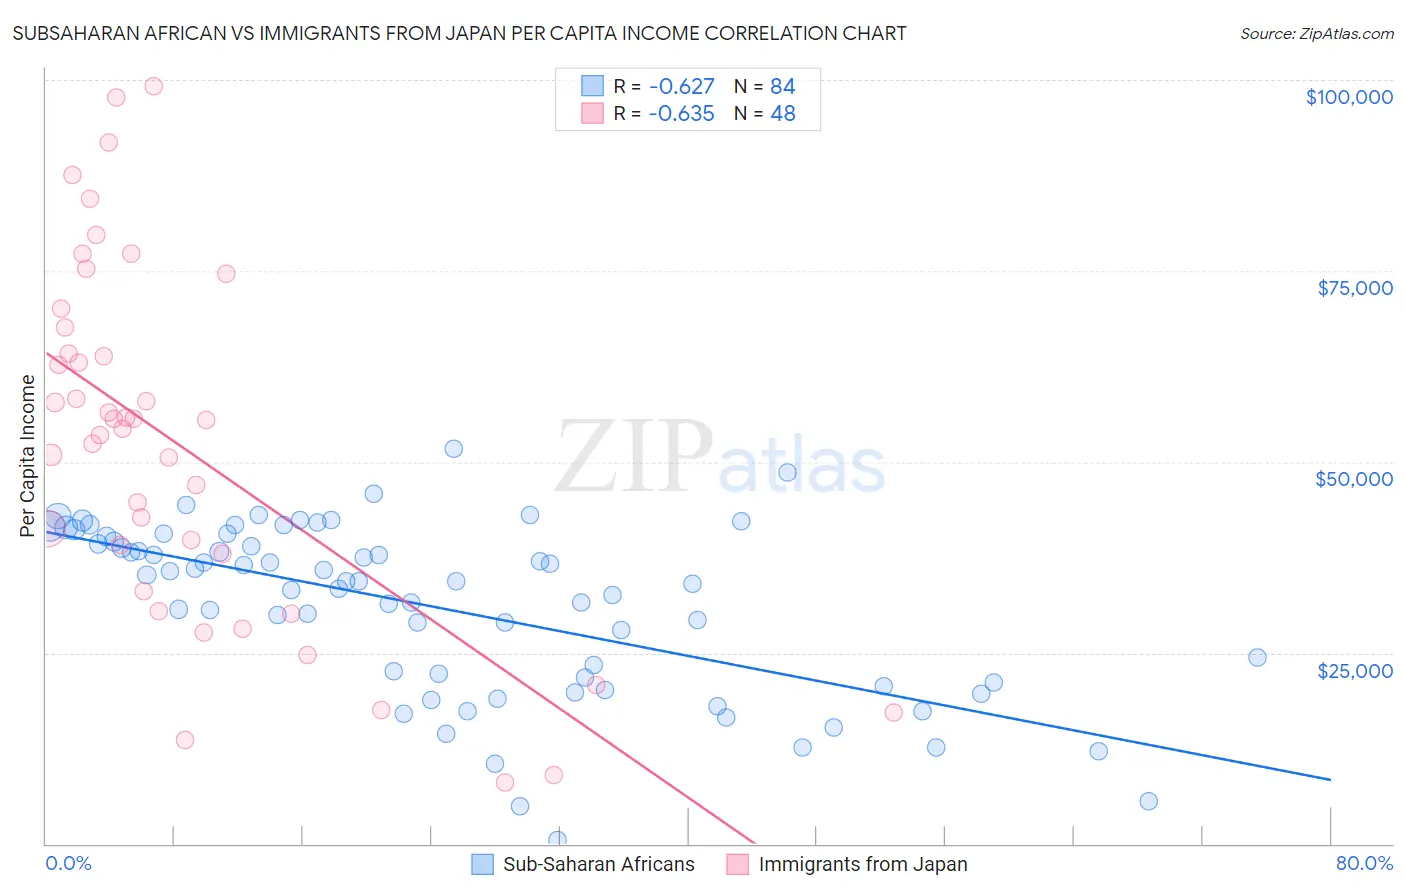
Subsaharan African vs Immigrants from Japan Per Capita Income Correlation Chart
The statistical analysis conducted on geographies consisting of 508,279,002 people shows a significant negative correlation between the proportion of Sub-Saharan Africans and per capita income in the United States with a correlation coefficient (R) of -0.627 and weighted average of $40,152. Similarly, the statistical analysis conducted on geographies consisting of 340,161,368 people shows a significant negative correlation between the proportion of Immigrants from Japan and per capita income in the United States with a correlation coefficient (R) of -0.635 and weighted average of $53,359, a difference of 32.9%.
Per Capita Income Correlation Summary
| Measurement | Subsaharan African | Immigrants from Japan |
| Minimum | $461 | $8,097 |
| Maximum | $51,790 | $99,130 |
| Range | $51,329 | $91,033 |
| Mean | $31,049 | $52,166 |
| Median | $34,354 | $54,914 |
| Interquartile 25% (IQ1) | $21,454 | $35,570 |
| Interquartile 75% (IQ3) | $39,919 | $65,919 |
| Interquartile Range (IQR) | $18,464 | $30,349 |
| Standard Deviation (Sample) | $11,215 | $23,163 |
| Standard Deviation (Population) | $11,148 | $22,920 |
Similar Demographics by Per Capita Income
Demographics Similar to Sub-Saharan Africans by Per Capita Income
In terms of per capita income, the demographic groups most similar to Sub-Saharan Africans are French American Indian ($40,244, a difference of 0.23%), Cree ($40,056, a difference of 0.24%), German Russian ($40,266, a difference of 0.28%), Immigrants from Western Africa ($40,294, a difference of 0.35%), and British West Indian ($40,330, a difference of 0.44%).
| Demographics | Rating | Rank | Per Capita Income |
| Somalis | 2.4 /100 | #238 | Tragic $40,367 |
| Tsimshian | 2.4 /100 | #239 | Tragic $40,344 |
| Immigrants | Nigeria | 2.3 /100 | #240 | Tragic $40,339 |
| British West Indians | 2.3 /100 | #241 | Tragic $40,330 |
| Immigrants | Western Africa | 2.2 /100 | #242 | Tragic $40,294 |
| German Russians | 2.2 /100 | #243 | Tragic $40,266 |
| French American Indians | 2.1 /100 | #244 | Tragic $40,244 |
| Sub-Saharan Africans | 1.9 /100 | #245 | Tragic $40,152 |
| Cree | 1.7 /100 | #246 | Tragic $40,056 |
| Immigrants | Somalia | 1.6 /100 | #247 | Tragic $39,974 |
| Cape Verdeans | 1.5 /100 | #248 | Tragic $39,935 |
| Japanese | 1.4 /100 | #249 | Tragic $39,870 |
| Immigrants | Burma/Myanmar | 1.3 /100 | #250 | Tragic $39,827 |
| Samoans | 1.3 /100 | #251 | Tragic $39,826 |
| Immigrants | Azores | 1.0 /100 | #252 | Tragic $39,608 |
Demographics Similar to Immigrants from Japan by Per Capita Income
In terms of per capita income, the demographic groups most similar to Immigrants from Japan are Russian ($53,154, a difference of 0.39%), Immigrants from Denmark ($53,799, a difference of 0.82%), Immigrants from Eastern Asia ($53,806, a difference of 0.84%), Indian (Asian) ($53,874, a difference of 0.97%), and Immigrants from South Central Asia ($52,660, a difference of 1.3%).
| Demographics | Rating | Rank | Per Capita Income |
| Thais | 100.0 /100 | #18 | Exceptional $54,307 |
| Immigrants | China | 100.0 /100 | #19 | Exceptional $54,264 |
| Soviet Union | 100.0 /100 | #20 | Exceptional $54,202 |
| Immigrants | Northern Europe | 100.0 /100 | #21 | Exceptional $54,159 |
| Indians (Asian) | 100.0 /100 | #22 | Exceptional $53,874 |
| Immigrants | Eastern Asia | 100.0 /100 | #23 | Exceptional $53,806 |
| Immigrants | Denmark | 100.0 /100 | #24 | Exceptional $53,799 |
| Immigrants | Japan | 100.0 /100 | #25 | Exceptional $53,359 |
| Russians | 100.0 /100 | #26 | Exceptional $53,154 |
| Immigrants | South Central Asia | 100.0 /100 | #27 | Exceptional $52,660 |
| Latvians | 100.0 /100 | #28 | Exceptional $52,649 |
| Israelis | 100.0 /100 | #29 | Exceptional $52,596 |
| Immigrants | Austria | 100.0 /100 | #30 | Exceptional $52,503 |
| Turks | 100.0 /100 | #31 | Exceptional $52,391 |
| Immigrants | Norway | 100.0 /100 | #32 | Exceptional $52,217 |