Subsaharan African vs Immigrants from Turkey Median Earnings
COMPARE
Subsaharan African
Immigrants from Turkey
Median Earnings
Median Earnings Comparison
Sub-Saharan Africans
Immigrants from Turkey
$44,118
MEDIAN EARNINGS
3.7/ 100
METRIC RATING
243rd/ 347
METRIC RANK
$52,960
MEDIAN EARNINGS
100.0/ 100
METRIC RATING
39th/ 347
METRIC RANK
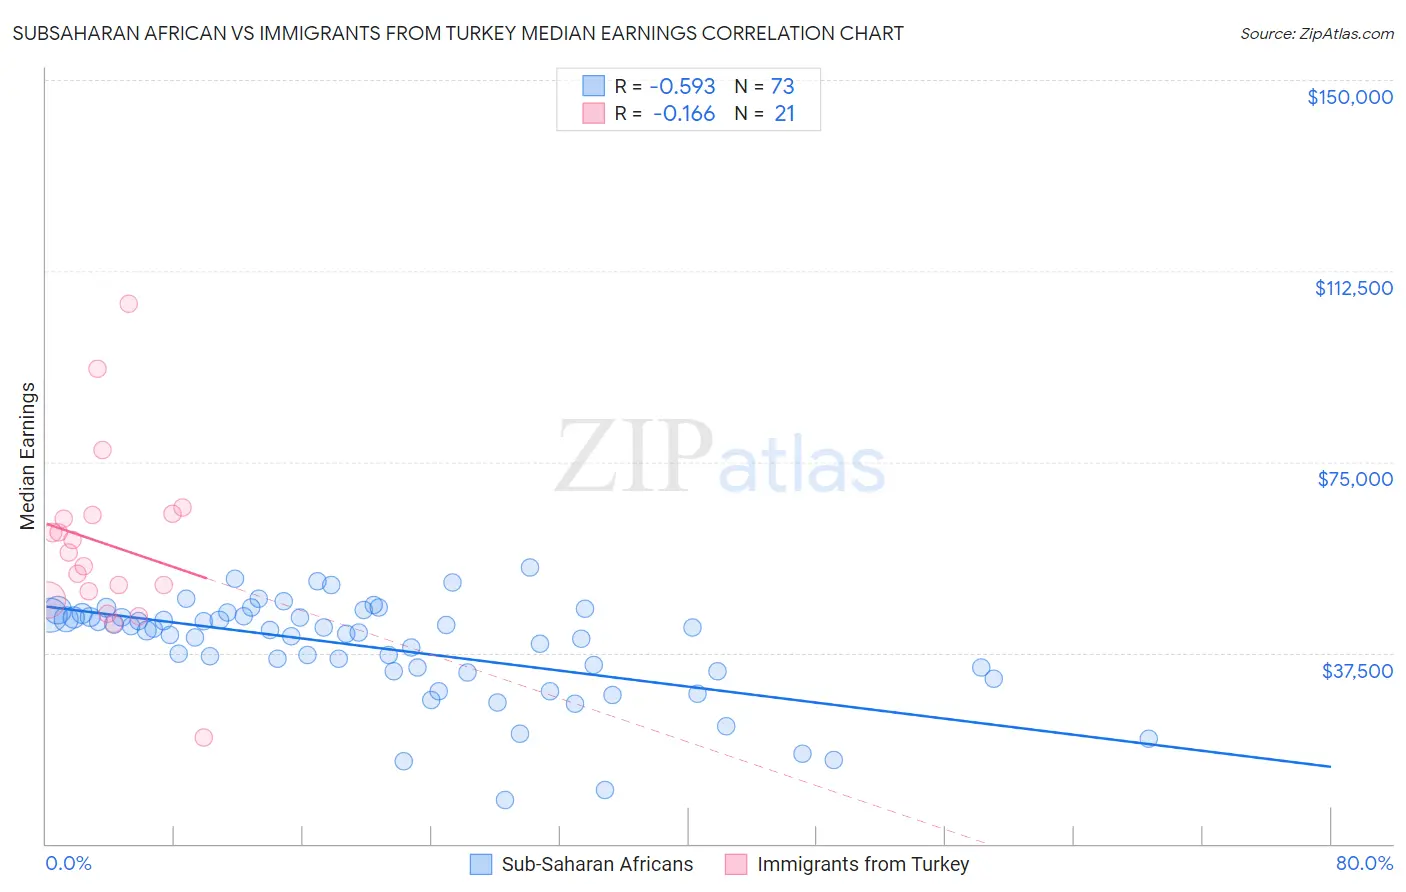
Subsaharan African vs Immigrants from Turkey Median Earnings Correlation Chart
The statistical analysis conducted on geographies consisting of 508,173,504 people shows a substantial negative correlation between the proportion of Sub-Saharan Africans and median earnings in the United States with a correlation coefficient (R) of -0.593 and weighted average of $44,118. Similarly, the statistical analysis conducted on geographies consisting of 223,042,474 people shows a poor negative correlation between the proportion of Immigrants from Turkey and median earnings in the United States with a correlation coefficient (R) of -0.166 and weighted average of $52,960, a difference of 20.0%.
Median Earnings Correlation Summary
| Measurement | Subsaharan African | Immigrants from Turkey |
| Minimum | $8,672 | $20,750 |
| Maximum | $54,367 | $106,061 |
| Range | $45,695 | $85,311 |
| Mean | $38,469 | $58,831 |
| Median | $41,866 | $57,227 |
| Interquartile 25% (IQ1) | $33,941 | $48,717 |
| Interquartile 75% (IQ3) | $44,774 | $64,687 |
| Interquartile Range (IQR) | $10,833 | $15,970 |
| Standard Deviation (Sample) | $9,878 | $17,879 |
| Standard Deviation (Population) | $9,810 | $17,448 |
Similar Demographics by Median Earnings
Demographics Similar to Sub-Saharan Africans by Median Earnings
In terms of median earnings, the demographic groups most similar to Sub-Saharan Africans are Nonimmigrants ($44,117, a difference of 0.0%), Immigrants from Venezuela ($44,163, a difference of 0.10%), Samoan ($44,206, a difference of 0.20%), Immigrants from Burma/Myanmar ($43,998, a difference of 0.27%), and Aleut ($44,241, a difference of 0.28%).
| Demographics | Rating | Rank | Median Earnings |
| British West Indians | 6.7 /100 | #236 | Tragic $44,552 |
| Immigrants | Ecuador | 5.9 /100 | #237 | Tragic $44,462 |
| Sudanese | 5.6 /100 | #238 | Tragic $44,419 |
| Senegalese | 5.3 /100 | #239 | Tragic $44,373 |
| Aleuts | 4.4 /100 | #240 | Tragic $44,241 |
| Samoans | 4.2 /100 | #241 | Tragic $44,206 |
| Immigrants | Venezuela | 4.0 /100 | #242 | Tragic $44,163 |
| Sub-Saharan Africans | 3.7 /100 | #243 | Tragic $44,118 |
| Immigrants | Nonimmigrants | 3.7 /100 | #244 | Tragic $44,117 |
| Immigrants | Burma/Myanmar | 3.2 /100 | #245 | Tragic $43,998 |
| Immigrants | West Indies | 3.1 /100 | #246 | Tragic $43,989 |
| Immigrants | Cabo Verde | 3.0 /100 | #247 | Tragic $43,963 |
| Nepalese | 2.6 /100 | #248 | Tragic $43,860 |
| Malaysians | 2.6 /100 | #249 | Tragic $43,844 |
| Alaska Natives | 2.3 /100 | #250 | Tragic $43,750 |
Demographics Similar to Immigrants from Turkey by Median Earnings
In terms of median earnings, the demographic groups most similar to Immigrants from Turkey are Israeli ($52,937, a difference of 0.040%), Latvian ($53,001, a difference of 0.080%), Immigrants from Belarus ($53,043, a difference of 0.16%), Immigrants from Lithuania ($52,769, a difference of 0.36%), and Immigrants from Denmark ($53,186, a difference of 0.43%).
| Demographics | Rating | Rank | Median Earnings |
| Immigrants | Asia | 100.0 /100 | #32 | Exceptional $53,310 |
| Immigrants | Greece | 100.0 /100 | #33 | Exceptional $53,282 |
| Immigrants | Sri Lanka | 100.0 /100 | #34 | Exceptional $53,268 |
| Immigrants | Switzerland | 100.0 /100 | #35 | Exceptional $53,211 |
| Immigrants | Denmark | 100.0 /100 | #36 | Exceptional $53,186 |
| Immigrants | Belarus | 100.0 /100 | #37 | Exceptional $53,043 |
| Latvians | 100.0 /100 | #38 | Exceptional $53,001 |
| Immigrants | Turkey | 100.0 /100 | #39 | Exceptional $52,960 |
| Israelis | 100.0 /100 | #40 | Exceptional $52,937 |
| Immigrants | Lithuania | 100.0 /100 | #41 | Exceptional $52,769 |
| Maltese | 100.0 /100 | #42 | Exceptional $52,526 |
| Immigrants | Malaysia | 100.0 /100 | #43 | Exceptional $52,514 |
| Bulgarians | 100.0 /100 | #44 | Exceptional $52,512 |
| Immigrants | Czechoslovakia | 100.0 /100 | #45 | Exceptional $52,361 |
| Bhutanese | 100.0 /100 | #46 | Exceptional $52,297 |