Subsaharan African vs Immigrants from Europe Median Earnings
COMPARE
Subsaharan African
Immigrants from Europe
Median Earnings
Median Earnings Comparison
Sub-Saharan Africans
Immigrants from Europe
$44,118
MEDIAN EARNINGS
3.7/ 100
METRIC RATING
243rd/ 347
METRIC RANK
$52,195
MEDIAN EARNINGS
100.0/ 100
METRIC RATING
48th/ 347
METRIC RANK
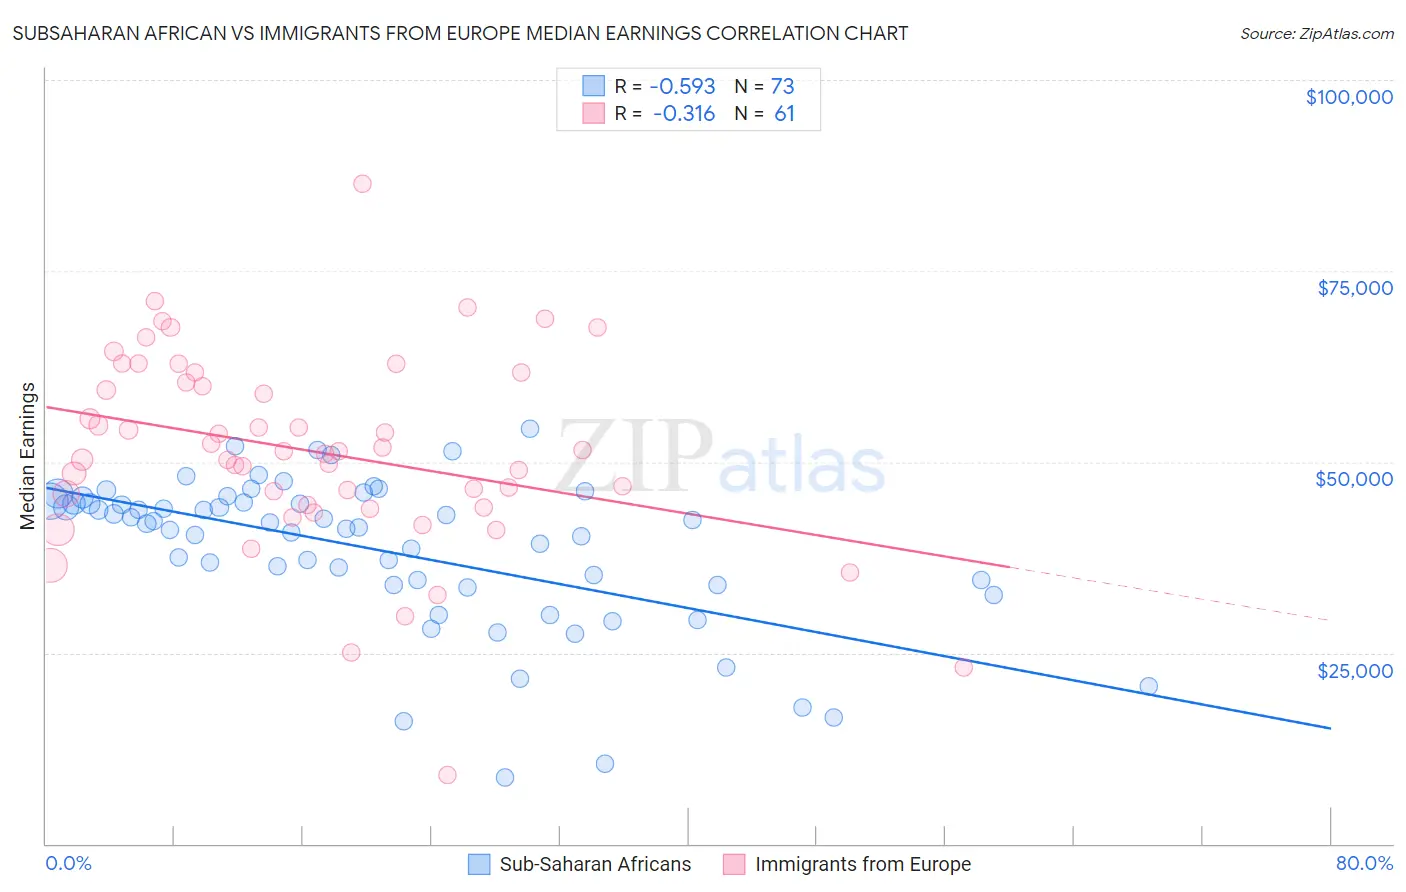
Subsaharan African vs Immigrants from Europe Median Earnings Correlation Chart
The statistical analysis conducted on geographies consisting of 508,173,504 people shows a substantial negative correlation between the proportion of Sub-Saharan Africans and median earnings in the United States with a correlation coefficient (R) of -0.593 and weighted average of $44,118. Similarly, the statistical analysis conducted on geographies consisting of 547,237,695 people shows a mild negative correlation between the proportion of Immigrants from Europe and median earnings in the United States with a correlation coefficient (R) of -0.316 and weighted average of $52,195, a difference of 18.3%.
Median Earnings Correlation Summary
| Measurement | Subsaharan African | Immigrants from Europe |
| Minimum | $8,672 | $9,082 |
| Maximum | $54,367 | $86,483 |
| Range | $45,695 | $77,401 |
| Mean | $38,469 | $51,354 |
| Median | $41,866 | $51,399 |
| Interquartile 25% (IQ1) | $33,941 | $44,212 |
| Interquartile 75% (IQ3) | $44,774 | $60,990 |
| Interquartile Range (IQR) | $10,833 | $16,778 |
| Standard Deviation (Sample) | $9,878 | $12,967 |
| Standard Deviation (Population) | $9,810 | $12,860 |
Similar Demographics by Median Earnings
Demographics Similar to Sub-Saharan Africans by Median Earnings
In terms of median earnings, the demographic groups most similar to Sub-Saharan Africans are Nonimmigrants ($44,117, a difference of 0.0%), Immigrants from Venezuela ($44,163, a difference of 0.10%), Samoan ($44,206, a difference of 0.20%), Immigrants from Burma/Myanmar ($43,998, a difference of 0.27%), and Aleut ($44,241, a difference of 0.28%).
| Demographics | Rating | Rank | Median Earnings |
| British West Indians | 6.7 /100 | #236 | Tragic $44,552 |
| Immigrants | Ecuador | 5.9 /100 | #237 | Tragic $44,462 |
| Sudanese | 5.6 /100 | #238 | Tragic $44,419 |
| Senegalese | 5.3 /100 | #239 | Tragic $44,373 |
| Aleuts | 4.4 /100 | #240 | Tragic $44,241 |
| Samoans | 4.2 /100 | #241 | Tragic $44,206 |
| Immigrants | Venezuela | 4.0 /100 | #242 | Tragic $44,163 |
| Sub-Saharan Africans | 3.7 /100 | #243 | Tragic $44,118 |
| Immigrants | Nonimmigrants | 3.7 /100 | #244 | Tragic $44,117 |
| Immigrants | Burma/Myanmar | 3.2 /100 | #245 | Tragic $43,998 |
| Immigrants | West Indies | 3.1 /100 | #246 | Tragic $43,989 |
| Immigrants | Cabo Verde | 3.0 /100 | #247 | Tragic $43,963 |
| Nepalese | 2.6 /100 | #248 | Tragic $43,860 |
| Malaysians | 2.6 /100 | #249 | Tragic $43,844 |
| Alaska Natives | 2.3 /100 | #250 | Tragic $43,750 |
Demographics Similar to Immigrants from Europe by Median Earnings
In terms of median earnings, the demographic groups most similar to Immigrants from Europe are Australian ($52,294, a difference of 0.19%), Bhutanese ($52,297, a difference of 0.20%), Immigrants from Czechoslovakia ($52,361, a difference of 0.32%), Bolivian ($52,005, a difference of 0.37%), and Immigrants from Malaysia ($52,514, a difference of 0.61%).
| Demographics | Rating | Rank | Median Earnings |
| Immigrants | Lithuania | 100.0 /100 | #41 | Exceptional $52,769 |
| Maltese | 100.0 /100 | #42 | Exceptional $52,526 |
| Immigrants | Malaysia | 100.0 /100 | #43 | Exceptional $52,514 |
| Bulgarians | 100.0 /100 | #44 | Exceptional $52,512 |
| Immigrants | Czechoslovakia | 100.0 /100 | #45 | Exceptional $52,361 |
| Bhutanese | 100.0 /100 | #46 | Exceptional $52,297 |
| Australians | 100.0 /100 | #47 | Exceptional $52,294 |
| Immigrants | Europe | 100.0 /100 | #48 | Exceptional $52,195 |
| Bolivians | 100.0 /100 | #49 | Exceptional $52,005 |
| Immigrants | South Africa | 100.0 /100 | #50 | Exceptional $51,850 |
| Immigrants | Austria | 99.9 /100 | #51 | Exceptional $51,826 |
| Estonians | 99.9 /100 | #52 | Exceptional $51,772 |
| Immigrants | Norway | 99.9 /100 | #53 | Exceptional $51,758 |
| Immigrants | Indonesia | 99.9 /100 | #54 | Exceptional $51,715 |
| Egyptians | 99.9 /100 | #55 | Exceptional $51,701 |