Immigrants from Sri Lanka vs Immigrants from Austria Median Family Income
COMPARE
Immigrants from Sri Lanka
Immigrants from Austria
Median Family Income
Median Family Income Comparison
Immigrants from Sri Lanka
Immigrants from Austria
$120,263
MEDIAN FAMILY INCOME
100.0/ 100
METRIC RATING
30th/ 347
METRIC RANK
$116,830
MEDIAN FAMILY INCOME
99.9/ 100
METRIC RATING
47th/ 347
METRIC RANK
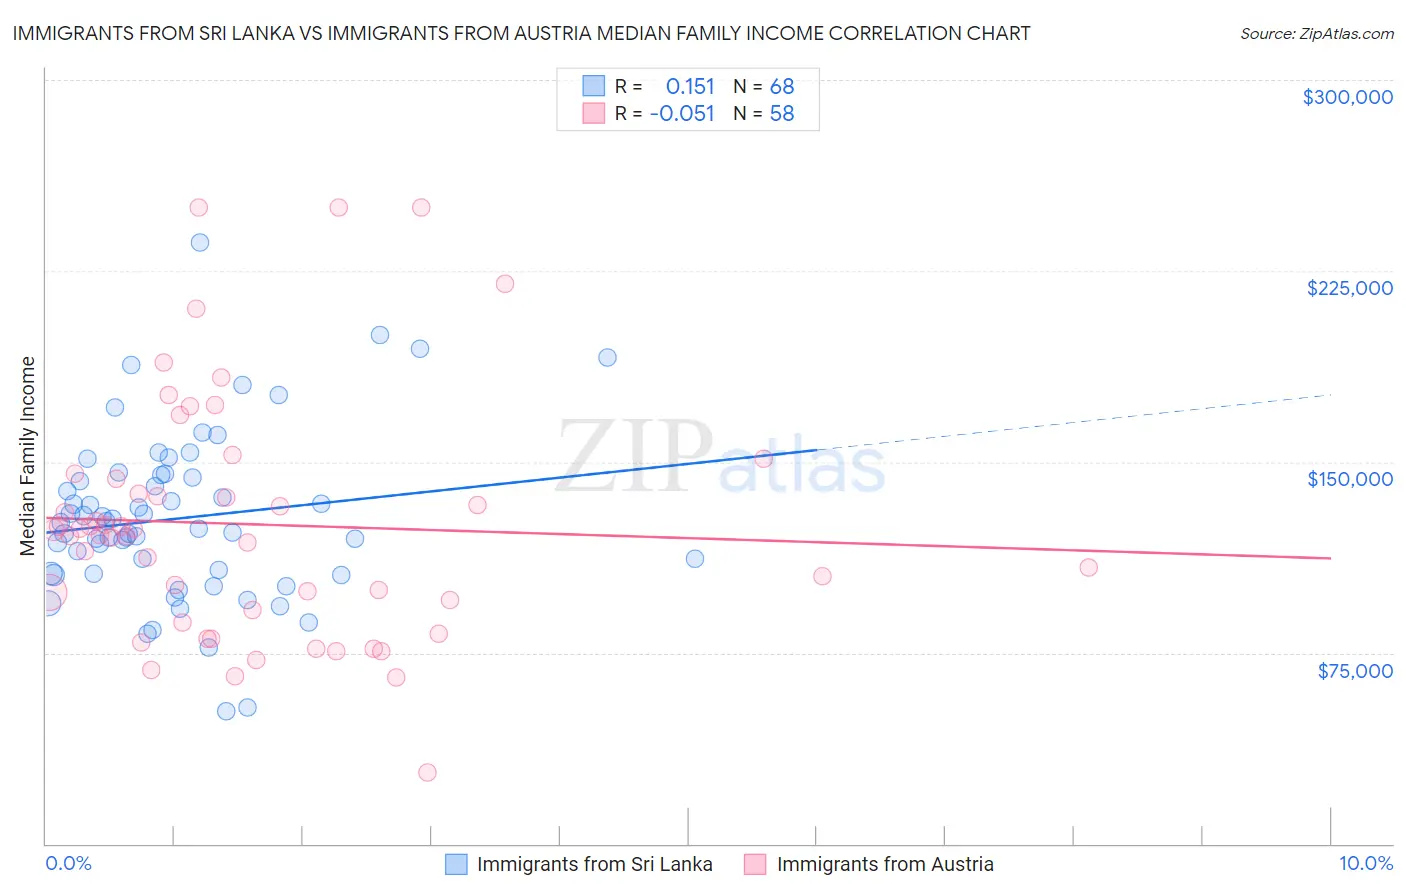
Immigrants from Sri Lanka vs Immigrants from Austria Median Family Income Correlation Chart
The statistical analysis conducted on geographies consisting of 149,663,280 people shows a poor positive correlation between the proportion of Immigrants from Sri Lanka and median family income in the United States with a correlation coefficient (R) of 0.151 and weighted average of $120,263. Similarly, the statistical analysis conducted on geographies consisting of 167,957,927 people shows a slight negative correlation between the proportion of Immigrants from Austria and median family income in the United States with a correlation coefficient (R) of -0.051 and weighted average of $116,830, a difference of 2.9%.
Median Family Income Correlation Summary
| Measurement | Immigrants from Sri Lanka | Immigrants from Austria |
| Minimum | $51,807 | $28,077 |
| Maximum | $236,102 | $250,001 |
| Range | $184,295 | $221,924 |
| Mean | $127,906 | $125,494 |
| Median | $125,011 | $122,176 |
| Interquartile 25% (IQ1) | $106,120 | $91,605 |
| Interquartile 75% (IQ3) | $144,308 | $143,362 |
| Interquartile Range (IQR) | $38,188 | $51,756 |
| Standard Deviation (Sample) | $33,114 | $47,633 |
| Standard Deviation (Population) | $32,870 | $47,221 |
Demographics Similar to Immigrants from Sri Lanka and Immigrants from Austria by Median Family Income
In terms of median family income, the demographic groups most similar to Immigrants from Sri Lanka are Latvian ($120,301, a difference of 0.030%), Immigrants from Denmark ($120,445, a difference of 0.15%), Immigrants from France ($120,076, a difference of 0.16%), Asian ($119,955, a difference of 0.26%), and Bhutanese ($119,800, a difference of 0.39%). Similarly, the demographic groups most similar to Immigrants from Austria are Immigrants from Russia ($116,942, a difference of 0.10%), Immigrants from Greece ($117,344, a difference of 0.44%), Immigrants from South Africa ($116,286, a difference of 0.47%), Cambodian ($117,780, a difference of 0.81%), and Bulgarian ($117,818, a difference of 0.85%).
| Demographics | Rating | Rank | Median Family Income |
| Immigrants | Denmark | 100.0 /100 | #28 | Exceptional $120,445 |
| Latvians | 100.0 /100 | #29 | Exceptional $120,301 |
| Immigrants | Sri Lanka | 100.0 /100 | #30 | Exceptional $120,263 |
| Immigrants | France | 100.0 /100 | #31 | Exceptional $120,076 |
| Asians | 100.0 /100 | #32 | Exceptional $119,955 |
| Bhutanese | 100.0 /100 | #33 | Exceptional $119,800 |
| Bolivians | 100.0 /100 | #34 | Exceptional $119,479 |
| Soviet Union | 100.0 /100 | #35 | Exceptional $119,262 |
| Israelis | 100.0 /100 | #36 | Exceptional $118,577 |
| Australians | 100.0 /100 | #37 | Exceptional $118,440 |
| Immigrants | Turkey | 100.0 /100 | #38 | Exceptional $118,325 |
| Immigrants | Asia | 100.0 /100 | #39 | Exceptional $118,291 |
| Immigrants | Lithuania | 100.0 /100 | #40 | Exceptional $118,053 |
| Estonians | 100.0 /100 | #41 | Exceptional $118,013 |
| Immigrants | Bolivia | 100.0 /100 | #42 | Exceptional $117,912 |
| Bulgarians | 100.0 /100 | #43 | Exceptional $117,818 |
| Cambodians | 100.0 /100 | #44 | Exceptional $117,780 |
| Immigrants | Greece | 99.9 /100 | #45 | Exceptional $117,344 |
| Immigrants | Russia | 99.9 /100 | #46 | Exceptional $116,942 |
| Immigrants | Austria | 99.9 /100 | #47 | Exceptional $116,830 |
| Immigrants | South Africa | 99.9 /100 | #48 | Exceptional $116,286 |