Immigrants from Dominican Republic vs Immigrants from Croatia Householder Income Over 65 years
COMPARE
Immigrants from Dominican Republic
Immigrants from Croatia
Householder Income Over 65 years
Householder Income Over 65 years Comparison
Immigrants from Dominican Republic
Immigrants from Croatia
$45,758
HOUSEHOLDER INCOME OVER 65 YEARS
0.0/ 100
METRIC RATING
343rd/ 347
METRIC RANK
$63,168
HOUSEHOLDER INCOME OVER 65 YEARS
90.9/ 100
METRIC RATING
117th/ 347
METRIC RANK
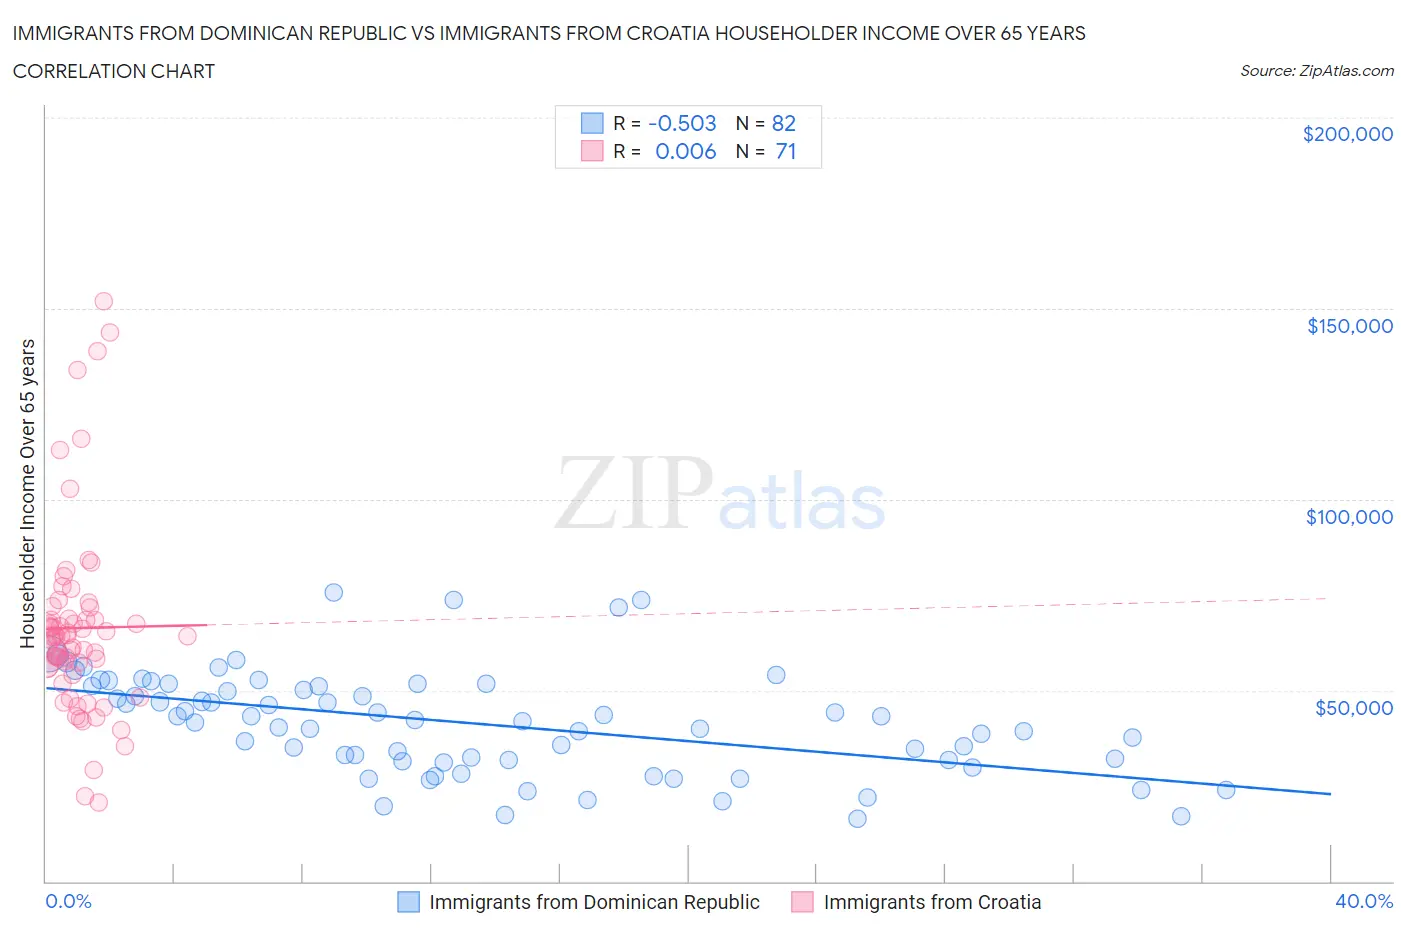
Immigrants from Dominican Republic vs Immigrants from Croatia Householder Income Over 65 years Correlation Chart
The statistical analysis conducted on geographies consisting of 274,205,000 people shows a substantial negative correlation between the proportion of Immigrants from Dominican Republic and household income with householder over the age of 65 in the United States with a correlation coefficient (R) of -0.503 and weighted average of $45,758. Similarly, the statistical analysis conducted on geographies consisting of 132,518,281 people shows no correlation between the proportion of Immigrants from Croatia and household income with householder over the age of 65 in the United States with a correlation coefficient (R) of 0.006 and weighted average of $63,168, a difference of 38.1%.
Householder Income Over 65 years Correlation Summary
| Measurement | Immigrants from Dominican Republic | Immigrants from Croatia |
| Minimum | $16,438 | $20,764 |
| Maximum | $75,483 | $151,983 |
| Range | $59,045 | $131,219 |
| Mean | $41,431 | $66,306 |
| Median | $42,056 | $64,003 |
| Interquartile 25% (IQ1) | $31,687 | $56,104 |
| Interquartile 75% (IQ3) | $51,139 | $68,616 |
| Interquartile Range (IQR) | $19,452 | $12,512 |
| Standard Deviation (Sample) | $13,458 | $24,936 |
| Standard Deviation (Population) | $13,375 | $24,760 |
Similar Demographics by Householder Income Over 65 years
Demographics Similar to Immigrants from Dominican Republic by Householder Income Over 65 years
In terms of householder income over 65 years, the demographic groups most similar to Immigrants from Dominican Republic are Immigrants from Cabo Verde ($46,654, a difference of 2.0%), Houma ($44,822, a difference of 2.1%), Immigrants from Cuba ($44,735, a difference of 2.3%), Dominican ($46,964, a difference of 2.6%), and Immigrants from Yemen ($47,527, a difference of 3.9%).
| Demographics | Rating | Rank | Householder Income Over 65 years |
| Cape Verdeans | 0.0 /100 | #333 | Tragic $50,077 |
| Immigrants | Dominica | 0.0 /100 | #334 | Tragic $50,071 |
| Crow | 0.0 /100 | #335 | Tragic $49,234 |
| Cubans | 0.0 /100 | #336 | Tragic $49,152 |
| Tohono O'odham | 0.0 /100 | #337 | Tragic $49,121 |
| Immigrants | Caribbean | 0.0 /100 | #338 | Tragic $48,535 |
| Navajo | 0.0 /100 | #339 | Tragic $47,722 |
| Immigrants | Yemen | 0.0 /100 | #340 | Tragic $47,527 |
| Dominicans | 0.0 /100 | #341 | Tragic $46,964 |
| Immigrants | Cabo Verde | 0.0 /100 | #342 | Tragic $46,654 |
| Immigrants | Dominican Republic | 0.0 /100 | #343 | Tragic $45,758 |
| Houma | 0.0 /100 | #344 | Tragic $44,822 |
| Immigrants | Cuba | 0.0 /100 | #345 | Tragic $44,735 |
| Puerto Ricans | 0.0 /100 | #346 | Tragic $42,550 |
| Lumbee | 0.0 /100 | #347 | Tragic $40,550 |
Demographics Similar to Immigrants from Croatia by Householder Income Over 65 years
In terms of householder income over 65 years, the demographic groups most similar to Immigrants from Croatia are Guamanian/Chamorro ($63,187, a difference of 0.030%), Danish ($63,117, a difference of 0.080%), Croatian ($63,225, a difference of 0.090%), Immigrants from Jordan ($63,041, a difference of 0.20%), and Ukrainian ($63,032, a difference of 0.22%).
| Demographics | Rating | Rank | Householder Income Over 65 years |
| Immigrants | Zimbabwe | 94.3 /100 | #110 | Exceptional $63,643 |
| Immigrants | Spain | 93.7 /100 | #111 | Exceptional $63,540 |
| Syrians | 93.4 /100 | #112 | Exceptional $63,494 |
| Immigrants | Serbia | 92.7 /100 | #113 | Exceptional $63,387 |
| Immigrants | Saudi Arabia | 92.4 /100 | #114 | Exceptional $63,355 |
| Croatians | 91.4 /100 | #115 | Exceptional $63,225 |
| Guamanians/Chamorros | 91.1 /100 | #116 | Exceptional $63,187 |
| Immigrants | Croatia | 90.9 /100 | #117 | Exceptional $63,168 |
| Danes | 90.5 /100 | #118 | Exceptional $63,117 |
| Immigrants | Jordan | 89.8 /100 | #119 | Excellent $63,041 |
| Ukrainians | 89.7 /100 | #120 | Excellent $63,032 |
| Immigrants | Vietnam | 89.5 /100 | #121 | Excellent $63,014 |
| Immigrants | Moldova | 88.7 /100 | #122 | Excellent $62,939 |
| Tlingit-Haida | 88.6 /100 | #123 | Excellent $62,922 |
| Taiwanese | 88.3 /100 | #124 | Excellent $62,894 |