Immigrants from Israel vs Guyanese Householder Income Over 65 years
COMPARE
Immigrants from Israel
Guyanese
Householder Income Over 65 years
Householder Income Over 65 years Comparison
Immigrants from Israel
Guyanese
$69,857
HOUSEHOLDER INCOME OVER 65 YEARS
100.0/ 100
METRIC RATING
22nd/ 347
METRIC RANK
$56,351
HOUSEHOLDER INCOME OVER 65 YEARS
0.8/ 100
METRIC RATING
243rd/ 347
METRIC RANK
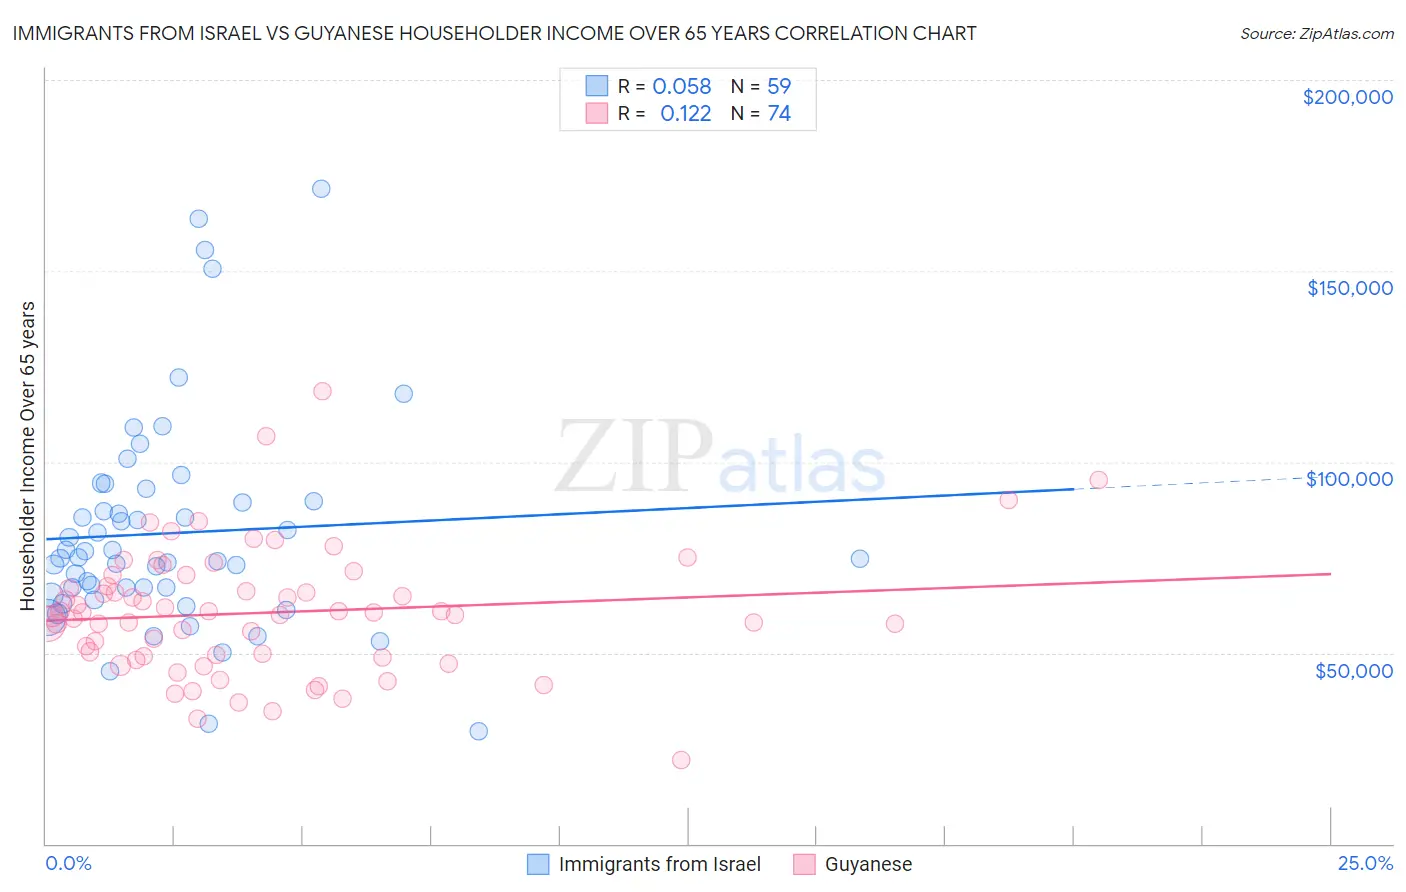
Immigrants from Israel vs Guyanese Householder Income Over 65 years Correlation Chart
The statistical analysis conducted on geographies consisting of 209,649,520 people shows a slight positive correlation between the proportion of Immigrants from Israel and household income with householder over the age of 65 in the United States with a correlation coefficient (R) of 0.058 and weighted average of $69,857. Similarly, the statistical analysis conducted on geographies consisting of 176,487,050 people shows a poor positive correlation between the proportion of Guyanese and household income with householder over the age of 65 in the United States with a correlation coefficient (R) of 0.122 and weighted average of $56,351, a difference of 24.0%.
Householder Income Over 65 years Correlation Summary
| Measurement | Immigrants from Israel | Guyanese |
| Minimum | $29,457 | $22,090 |
| Maximum | $171,563 | $118,508 |
| Range | $142,106 | $96,418 |
| Mean | $81,354 | $60,484 |
| Median | $74,737 | $60,185 |
| Interquartile 25% (IQ1) | $65,166 | $49,040 |
| Interquartile 75% (IQ3) | $89,688 | $67,479 |
| Interquartile Range (IQR) | $24,522 | $18,439 |
| Standard Deviation (Sample) | $28,278 | $16,619 |
| Standard Deviation (Population) | $28,038 | $16,506 |
Similar Demographics by Householder Income Over 65 years
Demographics Similar to Immigrants from Israel by Householder Income Over 65 years
In terms of householder income over 65 years, the demographic groups most similar to Immigrants from Israel are Immigrants from Eastern Asia ($69,872, a difference of 0.020%), Immigrants from Japan ($69,774, a difference of 0.12%), Immigrants from Sweden ($69,722, a difference of 0.19%), Immigrants from Belgium ($69,703, a difference of 0.22%), and Immigrants from South Central Asia ($70,103, a difference of 0.35%).
| Demographics | Rating | Rank | Householder Income Over 65 years |
| Native Hawaiians | 100.0 /100 | #15 | Exceptional $71,021 |
| Okinawans | 100.0 /100 | #16 | Exceptional $70,846 |
| Immigrants | Korea | 100.0 /100 | #17 | Exceptional $70,696 |
| Eastern Europeans | 100.0 /100 | #18 | Exceptional $70,470 |
| Indians (Asian) | 100.0 /100 | #19 | Exceptional $70,238 |
| Immigrants | South Central Asia | 100.0 /100 | #20 | Exceptional $70,103 |
| Immigrants | Eastern Asia | 100.0 /100 | #21 | Exceptional $69,872 |
| Immigrants | Israel | 100.0 /100 | #22 | Exceptional $69,857 |
| Immigrants | Japan | 100.0 /100 | #23 | Exceptional $69,774 |
| Immigrants | Sweden | 100.0 /100 | #24 | Exceptional $69,722 |
| Immigrants | Belgium | 100.0 /100 | #25 | Exceptional $69,703 |
| Immigrants | Sri Lanka | 100.0 /100 | #26 | Exceptional $69,426 |
| Immigrants | Switzerland | 100.0 /100 | #27 | Exceptional $69,343 |
| Immigrants | China | 100.0 /100 | #28 | Exceptional $69,174 |
| Immigrants | Australia | 100.0 /100 | #29 | Exceptional $69,164 |
Demographics Similar to Guyanese by Householder Income Over 65 years
In terms of householder income over 65 years, the demographic groups most similar to Guyanese are Hmong ($56,339, a difference of 0.020%), Immigrants from Uzbekistan ($56,331, a difference of 0.040%), Central American ($56,321, a difference of 0.050%), Yaqui ($56,417, a difference of 0.12%), and Yakama ($56,234, a difference of 0.21%).
| Demographics | Rating | Rank | Householder Income Over 65 years |
| Immigrants | Uruguay | 1.5 /100 | #236 | Tragic $56,975 |
| Immigrants | Panama | 1.5 /100 | #237 | Tragic $56,944 |
| Fijians | 1.2 /100 | #238 | Tragic $56,768 |
| Immigrants | Laos | 1.2 /100 | #239 | Tragic $56,722 |
| Sub-Saharan Africans | 1.0 /100 | #240 | Tragic $56,615 |
| Immigrants | Guyana | 0.9 /100 | #241 | Tragic $56,495 |
| Yaqui | 0.8 /100 | #242 | Tragic $56,417 |
| Guyanese | 0.8 /100 | #243 | Tragic $56,351 |
| Hmong | 0.8 /100 | #244 | Tragic $56,339 |
| Immigrants | Uzbekistan | 0.8 /100 | #245 | Tragic $56,331 |
| Central Americans | 0.8 /100 | #246 | Tragic $56,321 |
| Yakama | 0.7 /100 | #247 | Tragic $56,234 |
| Vietnamese | 0.6 /100 | #248 | Tragic $56,143 |
| Mexican American Indians | 0.6 /100 | #249 | Tragic $56,089 |
| Immigrants | Bosnia and Herzegovina | 0.5 /100 | #250 | Tragic $55,986 |