Sri Lankan vs Guyanese In Labor Force | Age 30-34
COMPARE
Sri Lankan
Guyanese
In Labor Force | Age 30-34
In Labor Force | Age 30-34 Comparison
Sri Lankans
Guyanese
85.0%
IN LABOR FORCE | AGE 30-34
87.8/ 100
METRIC RATING
138th/ 347
METRIC RANK
83.8%
IN LABOR FORCE | AGE 30-34
0.3/ 100
METRIC RATING
261st/ 347
METRIC RANK
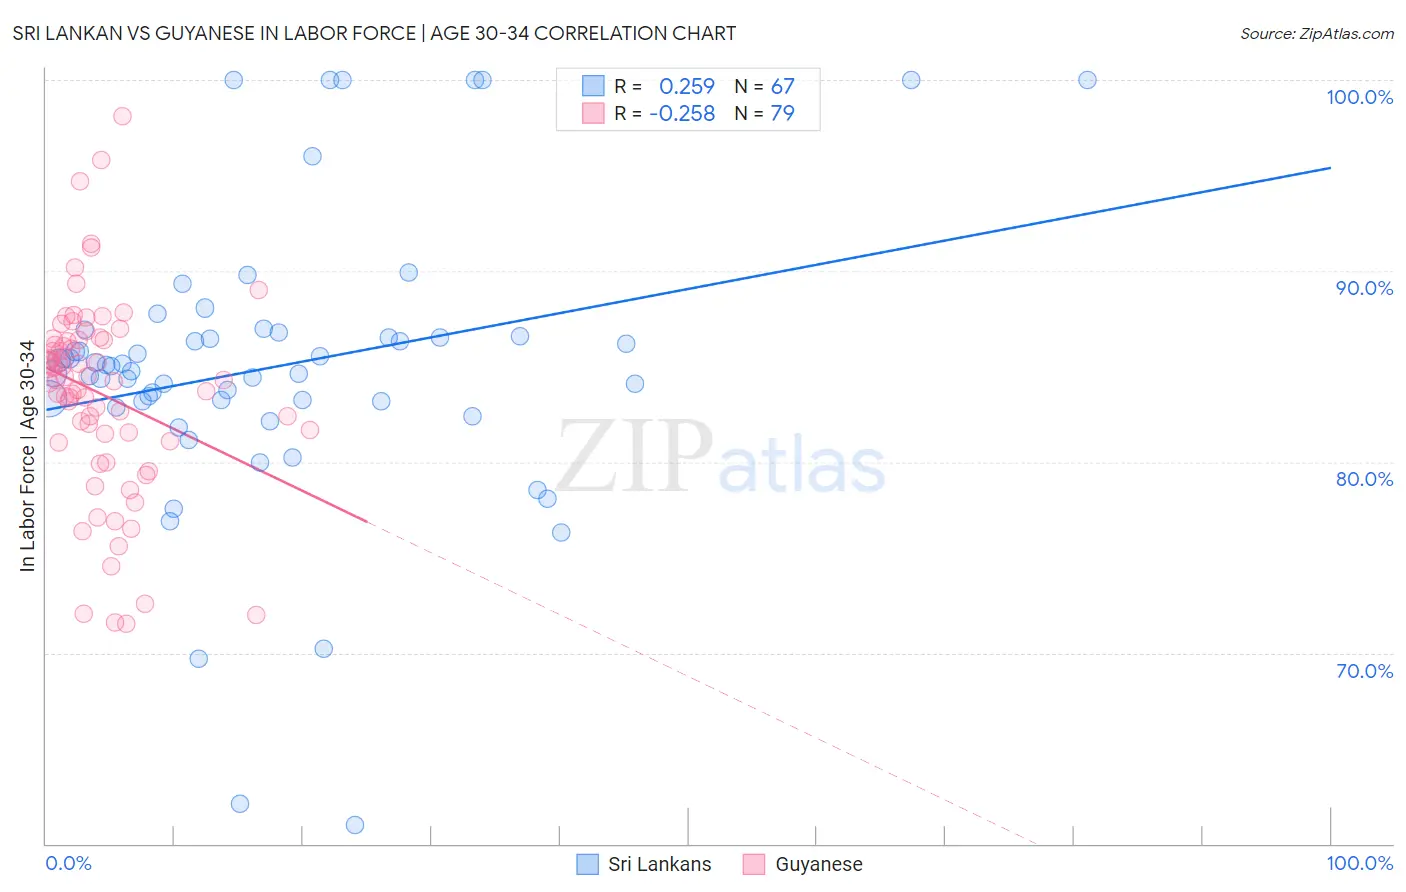
Sri Lankan vs Guyanese In Labor Force | Age 30-34 Correlation Chart
The statistical analysis conducted on geographies consisting of 440,177,214 people shows a weak positive correlation between the proportion of Sri Lankans and labor force participation rate among population between the ages 30 and 34 in the United States with a correlation coefficient (R) of 0.259 and weighted average of 85.0%. Similarly, the statistical analysis conducted on geographies consisting of 176,819,802 people shows a weak negative correlation between the proportion of Guyanese and labor force participation rate among population between the ages 30 and 34 in the United States with a correlation coefficient (R) of -0.258 and weighted average of 83.8%, a difference of 1.4%.
In Labor Force | Age 30-34 Correlation Summary
| Measurement | Sri Lankan | Guyanese |
| Minimum | 61.0% | 71.5% |
| Maximum | 100.0% | 98.1% |
| Range | 39.0% | 26.6% |
| Mean | 85.0% | 83.5% |
| Median | 85.0% | 84.3% |
| Interquartile 25% (IQ1) | 83.2% | 81.1% |
| Interquartile 75% (IQ3) | 86.6% | 86.4% |
| Interquartile Range (IQR) | 3.4% | 5.3% |
| Standard Deviation (Sample) | 7.6% | 5.2% |
| Standard Deviation (Population) | 7.5% | 5.2% |
Similar Demographics by In Labor Force | Age 30-34
Demographics Similar to Sri Lankans by In Labor Force | Age 30-34
In terms of in labor force | age 30-34, the demographic groups most similar to Sri Lankans are South African (85.0%, a difference of 0.0%), Jordanian (85.0%, a difference of 0.010%), Bhutanese (85.0%, a difference of 0.010%), Immigrants from Chile (85.0%, a difference of 0.020%), and Immigrants from Asia (85.0%, a difference of 0.020%).
| Demographics | Rating | Rank | In Labor Force | Age 30-34 |
| Chinese | 89.6 /100 | #131 | Excellent 85.0% |
| Immigrants | Israel | 89.5 /100 | #132 | Excellent 85.0% |
| New Zealanders | 89.5 /100 | #133 | Excellent 85.0% |
| Immigrants | Chile | 89.2 /100 | #134 | Excellent 85.0% |
| Immigrants | Asia | 88.9 /100 | #135 | Excellent 85.0% |
| Jordanians | 88.6 /100 | #136 | Excellent 85.0% |
| South Africans | 88.0 /100 | #137 | Excellent 85.0% |
| Sri Lankans | 87.8 /100 | #138 | Excellent 85.0% |
| Bhutanese | 87.5 /100 | #139 | Excellent 85.0% |
| Immigrants | Vietnam | 86.5 /100 | #140 | Excellent 85.0% |
| Chileans | 85.3 /100 | #141 | Excellent 84.9% |
| Immigrants | Indonesia | 84.3 /100 | #142 | Excellent 84.9% |
| Colombians | 82.2 /100 | #143 | Excellent 84.9% |
| Uruguayans | 78.5 /100 | #144 | Good 84.9% |
| Palestinians | 77.7 /100 | #145 | Good 84.9% |
Demographics Similar to Guyanese by In Labor Force | Age 30-34
In terms of in labor force | age 30-34, the demographic groups most similar to Guyanese are Immigrants from Dominican Republic (83.8%, a difference of 0.010%), Scotch-Irish (83.8%, a difference of 0.020%), Dominican (83.8%, a difference of 0.020%), Immigrants from Guyana (83.8%, a difference of 0.020%), and Honduran (83.8%, a difference of 0.030%).
| Demographics | Rating | Rank | In Labor Force | Age 30-34 |
| Immigrants | St. Vincent and the Grenadines | 0.5 /100 | #254 | Tragic 83.9% |
| Whites/Caucasians | 0.5 /100 | #255 | Tragic 83.9% |
| Immigrants | Lebanon | 0.4 /100 | #256 | Tragic 83.9% |
| Iraqis | 0.3 /100 | #257 | Tragic 83.8% |
| Hondurans | 0.3 /100 | #258 | Tragic 83.8% |
| Scotch-Irish | 0.3 /100 | #259 | Tragic 83.8% |
| Immigrants | Dominican Republic | 0.3 /100 | #260 | Tragic 83.8% |
| Guyanese | 0.3 /100 | #261 | Tragic 83.8% |
| Dominicans | 0.2 /100 | #262 | Tragic 83.8% |
| Immigrants | Guyana | 0.2 /100 | #263 | Tragic 83.8% |
| Guatemalans | 0.2 /100 | #264 | Tragic 83.7% |
| Immigrants | Honduras | 0.1 /100 | #265 | Tragic 83.7% |
| Immigrants | Guatemala | 0.1 /100 | #266 | Tragic 83.7% |
| Spaniards | 0.1 /100 | #267 | Tragic 83.6% |
| Immigrants | Bangladesh | 0.1 /100 | #268 | Tragic 83.6% |