Spanish vs British West Indian Householder Income Over 65 years
COMPARE
Spanish
British West Indian
Householder Income Over 65 years
Householder Income Over 65 years Comparison
Spanish
British West Indians
$60,795
HOUSEHOLDER INCOME OVER 65 YEARS
45.5/ 100
METRIC RATING
176th/ 347
METRIC RANK
$51,463
HOUSEHOLDER INCOME OVER 65 YEARS
0.0/ 100
METRIC RATING
322nd/ 347
METRIC RANK
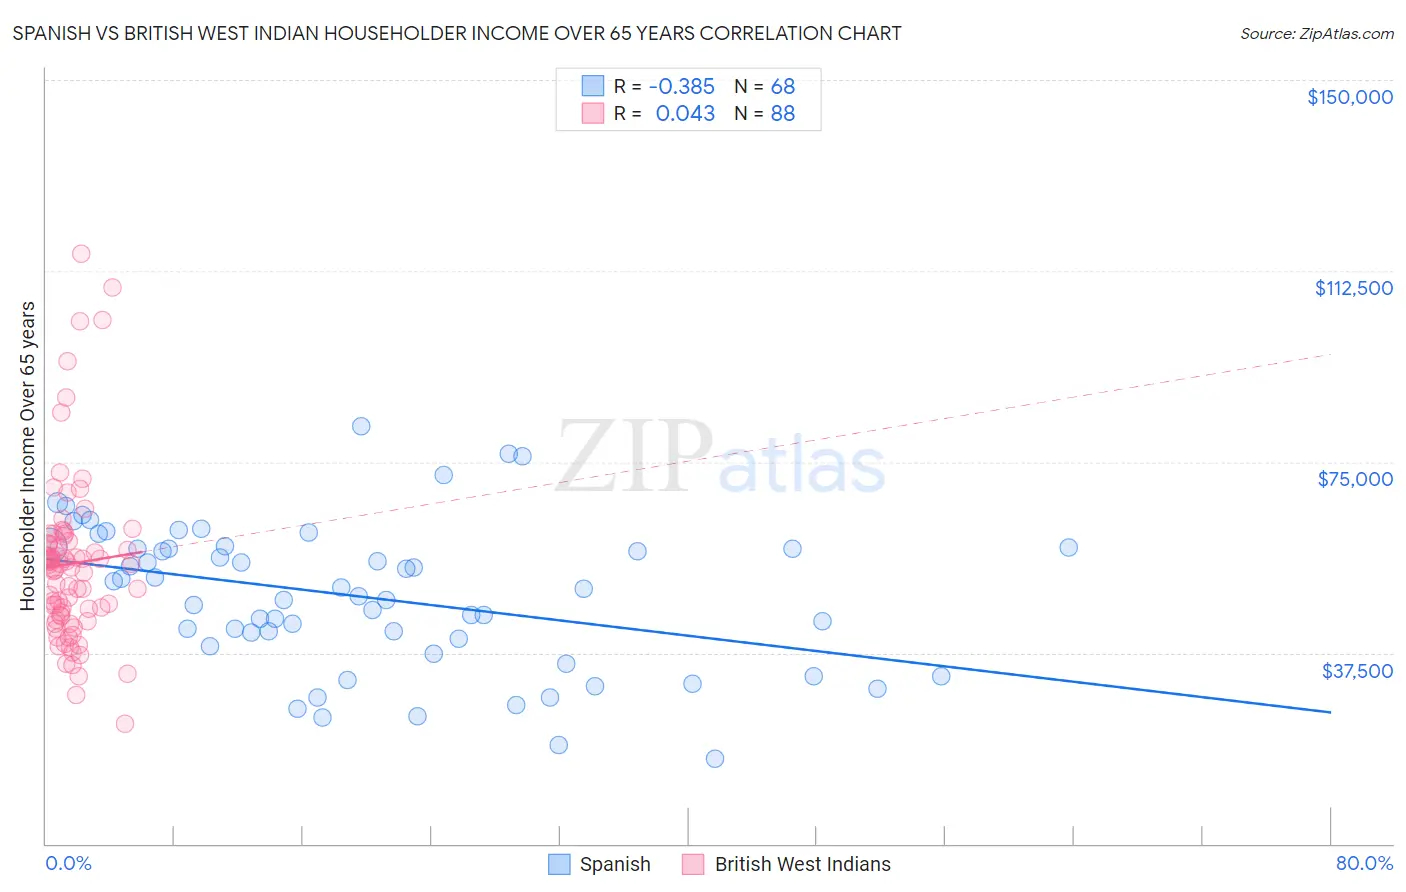
Spanish vs British West Indian Householder Income Over 65 years Correlation Chart
The statistical analysis conducted on geographies consisting of 420,502,206 people shows a mild negative correlation between the proportion of Spanish and household income with householder over the age of 65 in the United States with a correlation coefficient (R) of -0.385 and weighted average of $60,795. Similarly, the statistical analysis conducted on geographies consisting of 152,278,159 people shows no correlation between the proportion of British West Indians and household income with householder over the age of 65 in the United States with a correlation coefficient (R) of 0.043 and weighted average of $51,463, a difference of 18.1%.
Householder Income Over 65 years Correlation Summary
| Measurement | Spanish | British West Indian |
| Minimum | $16,667 | $23,659 |
| Maximum | $82,000 | $115,893 |
| Range | $65,333 | $92,234 |
| Mean | $48,467 | $54,999 |
| Median | $49,353 | $54,565 |
| Interquartile 25% (IQ1) | $39,610 | $44,759 |
| Interquartile 75% (IQ3) | $58,143 | $59,250 |
| Interquartile Range (IQR) | $18,533 | $14,491 |
| Standard Deviation (Sample) | $14,290 | $16,629 |
| Standard Deviation (Population) | $14,184 | $16,534 |
Similar Demographics by Householder Income Over 65 years
Demographics Similar to Spanish by Householder Income Over 65 years
In terms of householder income over 65 years, the demographic groups most similar to Spanish are Alaska Native ($60,748, a difference of 0.080%), Yup'ik ($60,727, a difference of 0.11%), Spaniard ($60,866, a difference of 0.12%), Welsh ($60,666, a difference of 0.21%), and Immigrants from Morocco ($60,647, a difference of 0.24%).
| Demographics | Rating | Rank | Householder Income Over 65 years |
| Carpatho Rusyns | 53.3 /100 | #169 | Average $61,093 |
| Serbians | 53.1 /100 | #170 | Average $61,087 |
| Inupiat | 52.4 /100 | #171 | Average $61,061 |
| Immigrants | Poland | 51.9 /100 | #172 | Average $61,041 |
| Immigrants | Micronesia | 50.8 /100 | #173 | Average $61,000 |
| Luxembourgers | 50.0 /100 | #174 | Average $60,967 |
| Spaniards | 47.3 /100 | #175 | Average $60,866 |
| Spanish | 45.5 /100 | #176 | Average $60,795 |
| Alaska Natives | 44.3 /100 | #177 | Average $60,748 |
| Yup'ik | 43.7 /100 | #178 | Average $60,727 |
| Welsh | 42.2 /100 | #179 | Average $60,666 |
| Immigrants | Morocco | 41.7 /100 | #180 | Average $60,647 |
| Celtics | 40.7 /100 | #181 | Average $60,608 |
| Czechoslovakians | 40.0 /100 | #182 | Average $60,581 |
| Kenyans | 38.4 /100 | #183 | Fair $60,514 |
Demographics Similar to British West Indians by Householder Income Over 65 years
In terms of householder income over 65 years, the demographic groups most similar to British West Indians are Cajun ($51,397, a difference of 0.13%), Immigrants from Congo ($51,393, a difference of 0.13%), Immigrants from Haiti ($51,219, a difference of 0.47%), Menominee ($51,719, a difference of 0.50%), and Colville ($51,739, a difference of 0.54%).
| Demographics | Rating | Rank | Householder Income Over 65 years |
| U.S. Virgin Islanders | 0.0 /100 | #315 | Tragic $52,072 |
| Creek | 0.0 /100 | #316 | Tragic $51,949 |
| Immigrants | St. Vincent and the Grenadines | 0.0 /100 | #317 | Tragic $51,922 |
| Haitians | 0.0 /100 | #318 | Tragic $51,912 |
| Immigrants | Honduras | 0.0 /100 | #319 | Tragic $51,888 |
| Colville | 0.0 /100 | #320 | Tragic $51,739 |
| Menominee | 0.0 /100 | #321 | Tragic $51,719 |
| British West Indians | 0.0 /100 | #322 | Tragic $51,463 |
| Cajuns | 0.0 /100 | #323 | Tragic $51,397 |
| Immigrants | Congo | 0.0 /100 | #324 | Tragic $51,393 |
| Immigrants | Haiti | 0.0 /100 | #325 | Tragic $51,219 |
| Kiowa | 0.0 /100 | #326 | Tragic $51,140 |
| Bahamians | 0.0 /100 | #327 | Tragic $51,000 |
| Hopi | 0.0 /100 | #328 | Tragic $50,925 |
| Blacks/African Americans | 0.0 /100 | #329 | Tragic $50,779 |