Spanish vs Immigrants from El Salvador Householder Income Over 65 years
COMPARE
Spanish
Immigrants from El Salvador
Householder Income Over 65 years
Householder Income Over 65 years Comparison
Spanish
Immigrants from El Salvador
$60,795
HOUSEHOLDER INCOME OVER 65 YEARS
45.5/ 100
METRIC RATING
176th/ 347
METRIC RANK
$58,226
HOUSEHOLDER INCOME OVER 65 YEARS
5.4/ 100
METRIC RATING
221st/ 347
METRIC RANK
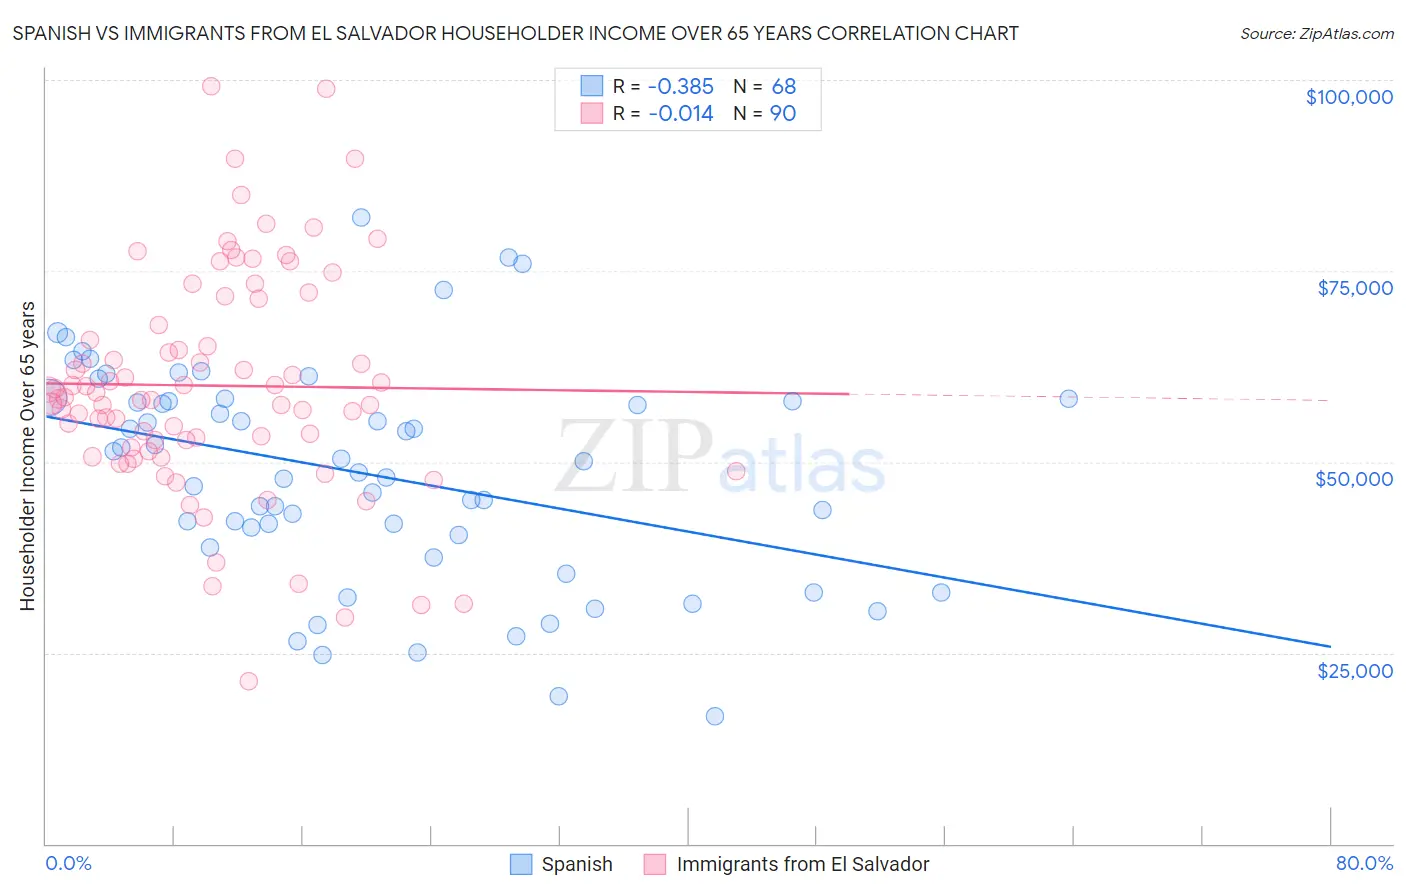
Spanish vs Immigrants from El Salvador Householder Income Over 65 years Correlation Chart
The statistical analysis conducted on geographies consisting of 420,502,206 people shows a mild negative correlation between the proportion of Spanish and household income with householder over the age of 65 in the United States with a correlation coefficient (R) of -0.385 and weighted average of $60,795. Similarly, the statistical analysis conducted on geographies consisting of 356,778,266 people shows no correlation between the proportion of Immigrants from El Salvador and household income with householder over the age of 65 in the United States with a correlation coefficient (R) of -0.014 and weighted average of $58,226, a difference of 4.4%.
Householder Income Over 65 years Correlation Summary
| Measurement | Spanish | Immigrants from El Salvador |
| Minimum | $16,667 | $21,250 |
| Maximum | $82,000 | $99,153 |
| Range | $65,333 | $77,903 |
| Mean | $48,467 | $59,987 |
| Median | $49,353 | $58,385 |
| Interquartile 25% (IQ1) | $39,610 | $51,905 |
| Interquartile 75% (IQ3) | $58,143 | $67,842 |
| Interquartile Range (IQR) | $18,533 | $15,937 |
| Standard Deviation (Sample) | $14,290 | $14,614 |
| Standard Deviation (Population) | $14,184 | $14,532 |
Similar Demographics by Householder Income Over 65 years
Demographics Similar to Spanish by Householder Income Over 65 years
In terms of householder income over 65 years, the demographic groups most similar to Spanish are Alaska Native ($60,748, a difference of 0.080%), Yup'ik ($60,727, a difference of 0.11%), Spaniard ($60,866, a difference of 0.12%), Welsh ($60,666, a difference of 0.21%), and Immigrants from Morocco ($60,647, a difference of 0.24%).
| Demographics | Rating | Rank | Householder Income Over 65 years |
| Carpatho Rusyns | 53.3 /100 | #169 | Average $61,093 |
| Serbians | 53.1 /100 | #170 | Average $61,087 |
| Inupiat | 52.4 /100 | #171 | Average $61,061 |
| Immigrants | Poland | 51.9 /100 | #172 | Average $61,041 |
| Immigrants | Micronesia | 50.8 /100 | #173 | Average $61,000 |
| Luxembourgers | 50.0 /100 | #174 | Average $60,967 |
| Spaniards | 47.3 /100 | #175 | Average $60,866 |
| Spanish | 45.5 /100 | #176 | Average $60,795 |
| Alaska Natives | 44.3 /100 | #177 | Average $60,748 |
| Yup'ik | 43.7 /100 | #178 | Average $60,727 |
| Welsh | 42.2 /100 | #179 | Average $60,666 |
| Immigrants | Morocco | 41.7 /100 | #180 | Average $60,647 |
| Celtics | 40.7 /100 | #181 | Average $60,608 |
| Czechoslovakians | 40.0 /100 | #182 | Average $60,581 |
| Kenyans | 38.4 /100 | #183 | Fair $60,514 |
Demographics Similar to Immigrants from El Salvador by Householder Income Over 65 years
In terms of householder income over 65 years, the demographic groups most similar to Immigrants from El Salvador are Delaware ($58,214, a difference of 0.020%), Malaysian ($58,244, a difference of 0.030%), Yugoslavian ($58,243, a difference of 0.030%), Tsimshian ($58,202, a difference of 0.040%), and Panamanian ($58,266, a difference of 0.070%).
| Demographics | Rating | Rank | Householder Income Over 65 years |
| Nepalese | 9.0 /100 | #214 | Tragic $58,761 |
| Immigrants | Ghana | 7.9 /100 | #215 | Tragic $58,624 |
| Immigrants | Middle Africa | 6.2 /100 | #216 | Tragic $58,375 |
| Sudanese | 5.7 /100 | #217 | Tragic $58,281 |
| Panamanians | 5.6 /100 | #218 | Tragic $58,266 |
| Malaysians | 5.5 /100 | #219 | Tragic $58,244 |
| Yugoslavians | 5.5 /100 | #220 | Tragic $58,243 |
| Immigrants | El Salvador | 5.4 /100 | #221 | Tragic $58,226 |
| Delaware | 5.3 /100 | #222 | Tragic $58,214 |
| Tsimshian | 5.2 /100 | #223 | Tragic $58,202 |
| Bermudans | 5.1 /100 | #224 | Tragic $58,171 |
| Venezuelans | 4.4 /100 | #225 | Tragic $58,026 |
| French Canadians | 4.2 /100 | #226 | Tragic $57,975 |
| Japanese | 3.9 /100 | #227 | Tragic $57,919 |
| Immigrants | Albania | 3.6 /100 | #228 | Tragic $57,828 |