Spanish American Indian vs British West Indian Householder Income Over 65 years
COMPARE
Spanish American Indian
British West Indian
Householder Income Over 65 years
Householder Income Over 65 years Comparison
Spanish American Indians
British West Indians
$53,077
HOUSEHOLDER INCOME OVER 65 YEARS
0.0/ 100
METRIC RATING
302nd/ 347
METRIC RANK
$51,463
HOUSEHOLDER INCOME OVER 65 YEARS
0.0/ 100
METRIC RATING
322nd/ 347
METRIC RANK
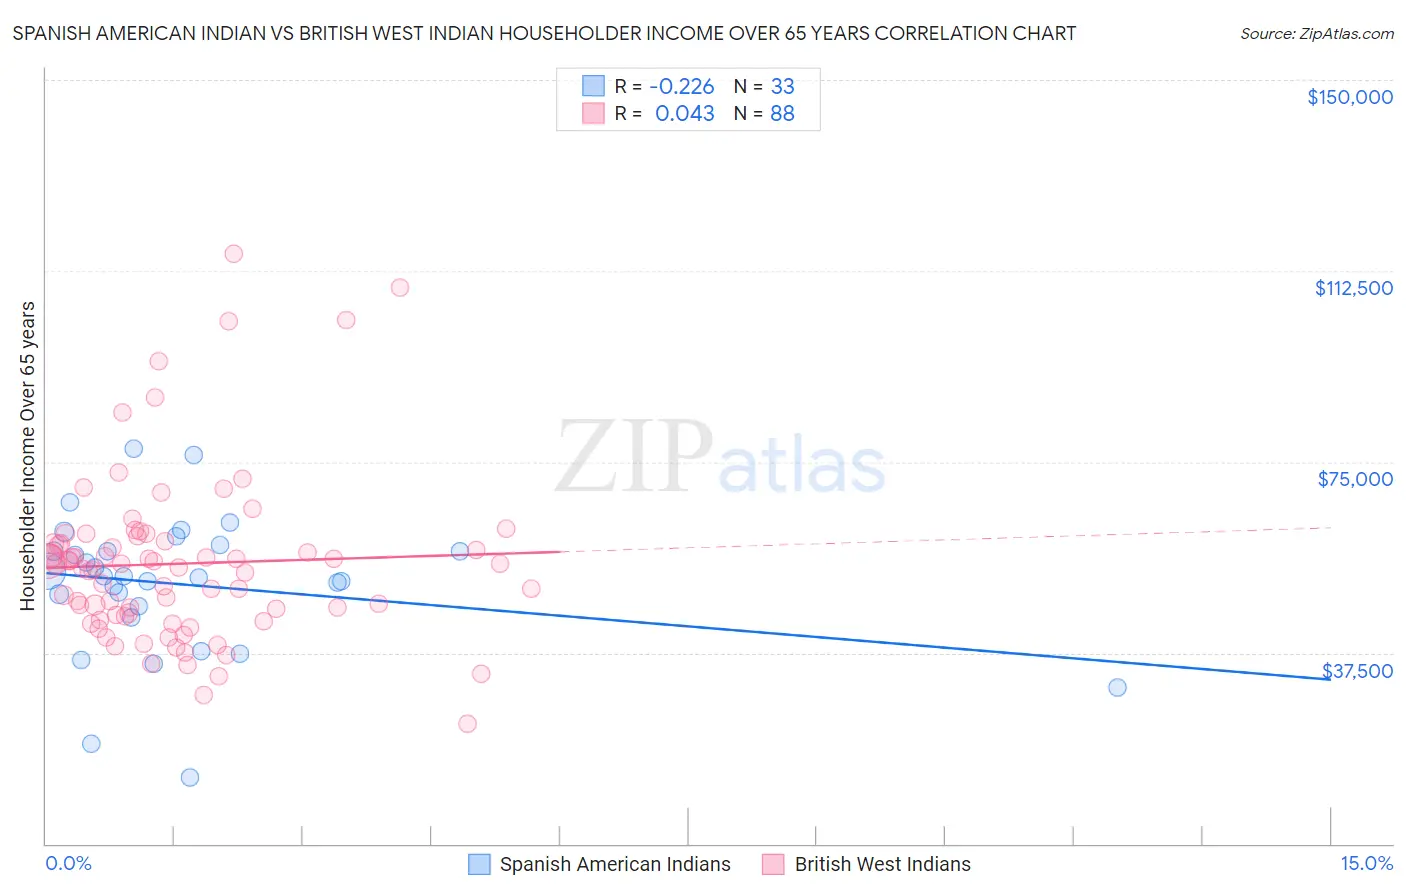
Spanish American Indian vs British West Indian Householder Income Over 65 years Correlation Chart
The statistical analysis conducted on geographies consisting of 73,128,660 people shows a weak negative correlation between the proportion of Spanish American Indians and household income with householder over the age of 65 in the United States with a correlation coefficient (R) of -0.226 and weighted average of $53,077. Similarly, the statistical analysis conducted on geographies consisting of 152,278,159 people shows no correlation between the proportion of British West Indians and household income with householder over the age of 65 in the United States with a correlation coefficient (R) of 0.043 and weighted average of $51,463, a difference of 3.1%.
Householder Income Over 65 years Correlation Summary
| Measurement | Spanish American Indian | British West Indian |
| Minimum | $13,050 | $23,659 |
| Maximum | $77,490 | $115,893 |
| Range | $64,440 | $92,234 |
| Mean | $50,895 | $54,999 |
| Median | $52,508 | $54,565 |
| Interquartile 25% (IQ1) | $45,560 | $44,759 |
| Interquartile 75% (IQ3) | $58,154 | $59,250 |
| Interquartile Range (IQR) | $12,594 | $14,491 |
| Standard Deviation (Sample) | $13,736 | $16,629 |
| Standard Deviation (Population) | $13,526 | $16,534 |
Demographics Similar to Spanish American Indians and British West Indians by Householder Income Over 65 years
In terms of householder income over 65 years, the demographic groups most similar to Spanish American Indians are Choctaw ($53,060, a difference of 0.030%), Ute ($52,949, a difference of 0.24%), Pueblo ($52,930, a difference of 0.28%), Pennsylvania German ($52,888, a difference of 0.36%), and Hispanic or Latino ($52,832, a difference of 0.46%). Similarly, the demographic groups most similar to British West Indians are Menominee ($51,719, a difference of 0.50%), Colville ($51,739, a difference of 0.54%), Immigrants from Honduras ($51,888, a difference of 0.83%), Haitian ($51,912, a difference of 0.87%), and Immigrants from St. Vincent and the Grenadines ($51,922, a difference of 0.89%).
| Demographics | Rating | Rank | Householder Income Over 65 years |
| Spanish American Indians | 0.0 /100 | #302 | Tragic $53,077 |
| Choctaw | 0.0 /100 | #303 | Tragic $53,060 |
| Ute | 0.0 /100 | #304 | Tragic $52,949 |
| Pueblo | 0.0 /100 | #305 | Tragic $52,930 |
| Pennsylvania Germans | 0.0 /100 | #306 | Tragic $52,888 |
| Hispanics or Latinos | 0.0 /100 | #307 | Tragic $52,832 |
| Immigrants | Mexico | 0.0 /100 | #308 | Tragic $52,801 |
| Hondurans | 0.0 /100 | #309 | Tragic $52,634 |
| Sioux | 0.0 /100 | #310 | Tragic $52,509 |
| Seminole | 0.0 /100 | #311 | Tragic $52,373 |
| Immigrants | Azores | 0.0 /100 | #312 | Tragic $52,121 |
| Immigrants | Nicaragua | 0.0 /100 | #313 | Tragic $52,085 |
| Natives/Alaskans | 0.0 /100 | #314 | Tragic $52,081 |
| U.S. Virgin Islanders | 0.0 /100 | #315 | Tragic $52,072 |
| Creek | 0.0 /100 | #316 | Tragic $51,949 |
| Immigrants | St. Vincent and the Grenadines | 0.0 /100 | #317 | Tragic $51,922 |
| Haitians | 0.0 /100 | #318 | Tragic $51,912 |
| Immigrants | Honduras | 0.0 /100 | #319 | Tragic $51,888 |
| Colville | 0.0 /100 | #320 | Tragic $51,739 |
| Menominee | 0.0 /100 | #321 | Tragic $51,719 |
| British West Indians | 0.0 /100 | #322 | Tragic $51,463 |