Immigrants from Yemen vs British West Indian Householder Income Over 65 years
COMPARE
Immigrants from Yemen
British West Indian
Householder Income Over 65 years
Householder Income Over 65 years Comparison
Immigrants from Yemen
British West Indians
$47,527
HOUSEHOLDER INCOME OVER 65 YEARS
0.0/ 100
METRIC RATING
340th/ 347
METRIC RANK
$51,463
HOUSEHOLDER INCOME OVER 65 YEARS
0.0/ 100
METRIC RATING
322nd/ 347
METRIC RANK
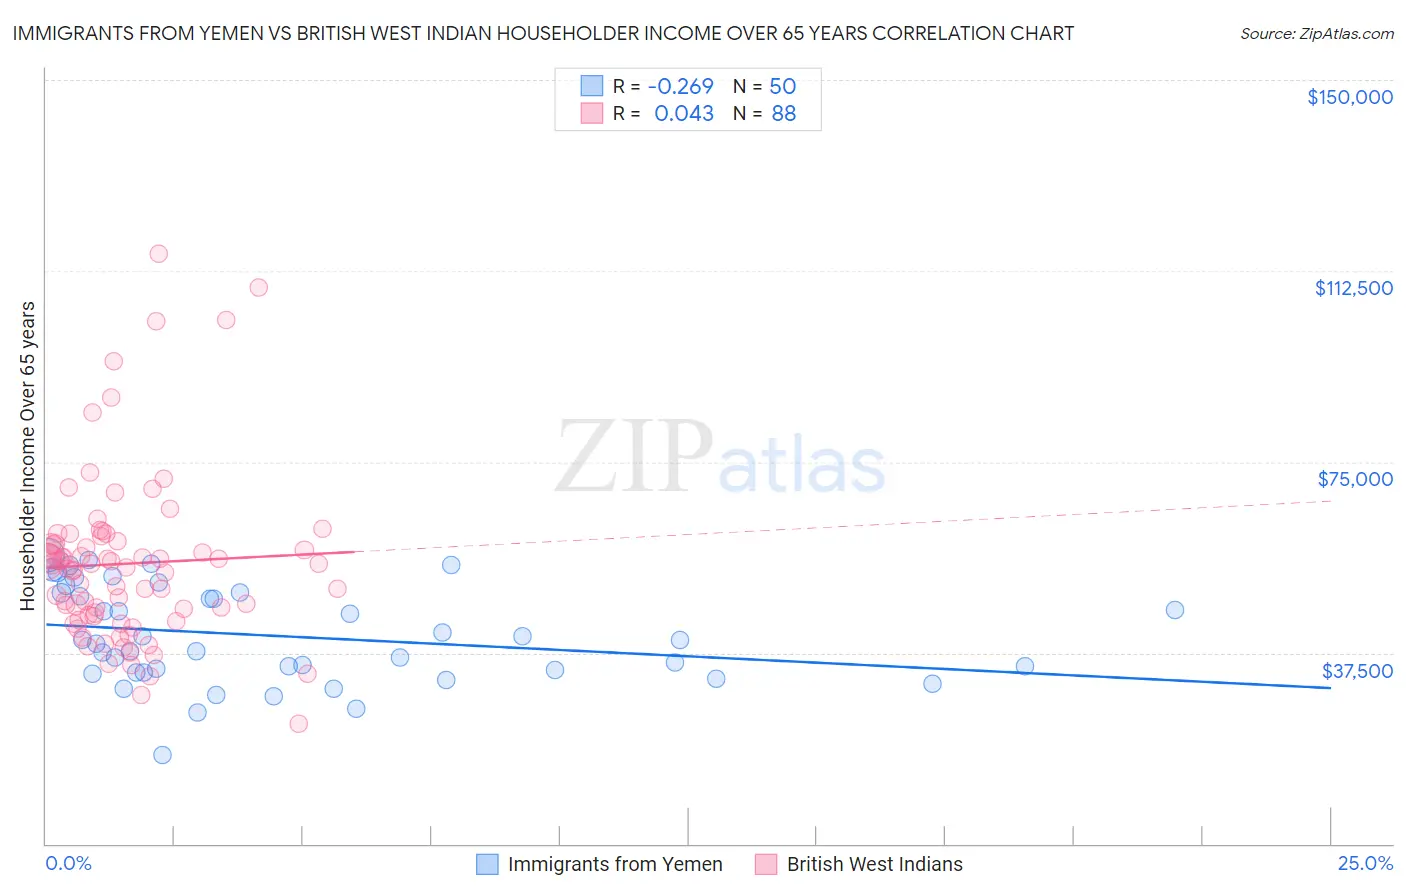
Immigrants from Yemen vs British West Indian Householder Income Over 65 years Correlation Chart
The statistical analysis conducted on geographies consisting of 82,406,704 people shows a weak negative correlation between the proportion of Immigrants from Yemen and household income with householder over the age of 65 in the United States with a correlation coefficient (R) of -0.269 and weighted average of $47,527. Similarly, the statistical analysis conducted on geographies consisting of 152,278,159 people shows no correlation between the proportion of British West Indians and household income with householder over the age of 65 in the United States with a correlation coefficient (R) of 0.043 and weighted average of $51,463, a difference of 8.3%.
Householder Income Over 65 years Correlation Summary
| Measurement | Immigrants from Yemen | British West Indian |
| Minimum | $17,404 | $23,659 |
| Maximum | $56,646 | $115,893 |
| Range | $39,242 | $92,234 |
| Mean | $40,803 | $54,999 |
| Median | $39,631 | $54,565 |
| Interquartile 25% (IQ1) | $33,662 | $44,759 |
| Interquartile 75% (IQ3) | $49,266 | $59,250 |
| Interquartile Range (IQR) | $15,604 | $14,491 |
| Standard Deviation (Sample) | $9,491 | $16,629 |
| Standard Deviation (Population) | $9,395 | $16,534 |
Demographics Similar to Immigrants from Yemen and British West Indians by Householder Income Over 65 years
In terms of householder income over 65 years, the demographic groups most similar to Immigrants from Yemen are Navajo ($47,722, a difference of 0.41%), Dominican ($46,964, a difference of 1.2%), Immigrants from Caribbean ($48,535, a difference of 2.1%), Tohono O'odham ($49,121, a difference of 3.4%), and Cuban ($49,152, a difference of 3.4%). Similarly, the demographic groups most similar to British West Indians are Cajun ($51,397, a difference of 0.13%), Immigrants from Congo ($51,393, a difference of 0.13%), Immigrants from Haiti ($51,219, a difference of 0.47%), Menominee ($51,719, a difference of 0.50%), and Kiowa ($51,140, a difference of 0.63%).
| Demographics | Rating | Rank | Householder Income Over 65 years |
| Menominee | 0.0 /100 | #321 | Tragic $51,719 |
| British West Indians | 0.0 /100 | #322 | Tragic $51,463 |
| Cajuns | 0.0 /100 | #323 | Tragic $51,397 |
| Immigrants | Congo | 0.0 /100 | #324 | Tragic $51,393 |
| Immigrants | Haiti | 0.0 /100 | #325 | Tragic $51,219 |
| Kiowa | 0.0 /100 | #326 | Tragic $51,140 |
| Bahamians | 0.0 /100 | #327 | Tragic $51,000 |
| Hopi | 0.0 /100 | #328 | Tragic $50,925 |
| Blacks/African Americans | 0.0 /100 | #329 | Tragic $50,779 |
| Immigrants | Grenada | 0.0 /100 | #330 | Tragic $50,747 |
| Pima | 0.0 /100 | #331 | Tragic $50,539 |
| Dutch West Indians | 0.0 /100 | #332 | Tragic $50,475 |
| Cape Verdeans | 0.0 /100 | #333 | Tragic $50,077 |
| Immigrants | Dominica | 0.0 /100 | #334 | Tragic $50,071 |
| Crow | 0.0 /100 | #335 | Tragic $49,234 |
| Cubans | 0.0 /100 | #336 | Tragic $49,152 |
| Tohono O'odham | 0.0 /100 | #337 | Tragic $49,121 |
| Immigrants | Caribbean | 0.0 /100 | #338 | Tragic $48,535 |
| Navajo | 0.0 /100 | #339 | Tragic $47,722 |
| Immigrants | Yemen | 0.0 /100 | #340 | Tragic $47,527 |
| Dominicans | 0.0 /100 | #341 | Tragic $46,964 |