Spanish vs Albanian Householder Income Over 65 years
COMPARE
Spanish
Albanian
Householder Income Over 65 years
Householder Income Over 65 years Comparison
Spanish
Albanians
$60,795
HOUSEHOLDER INCOME OVER 65 YEARS
45.5/ 100
METRIC RATING
176th/ 347
METRIC RANK
$60,249
HOUSEHOLDER INCOME OVER 65 YEARS
32.0/ 100
METRIC RATING
185th/ 347
METRIC RANK
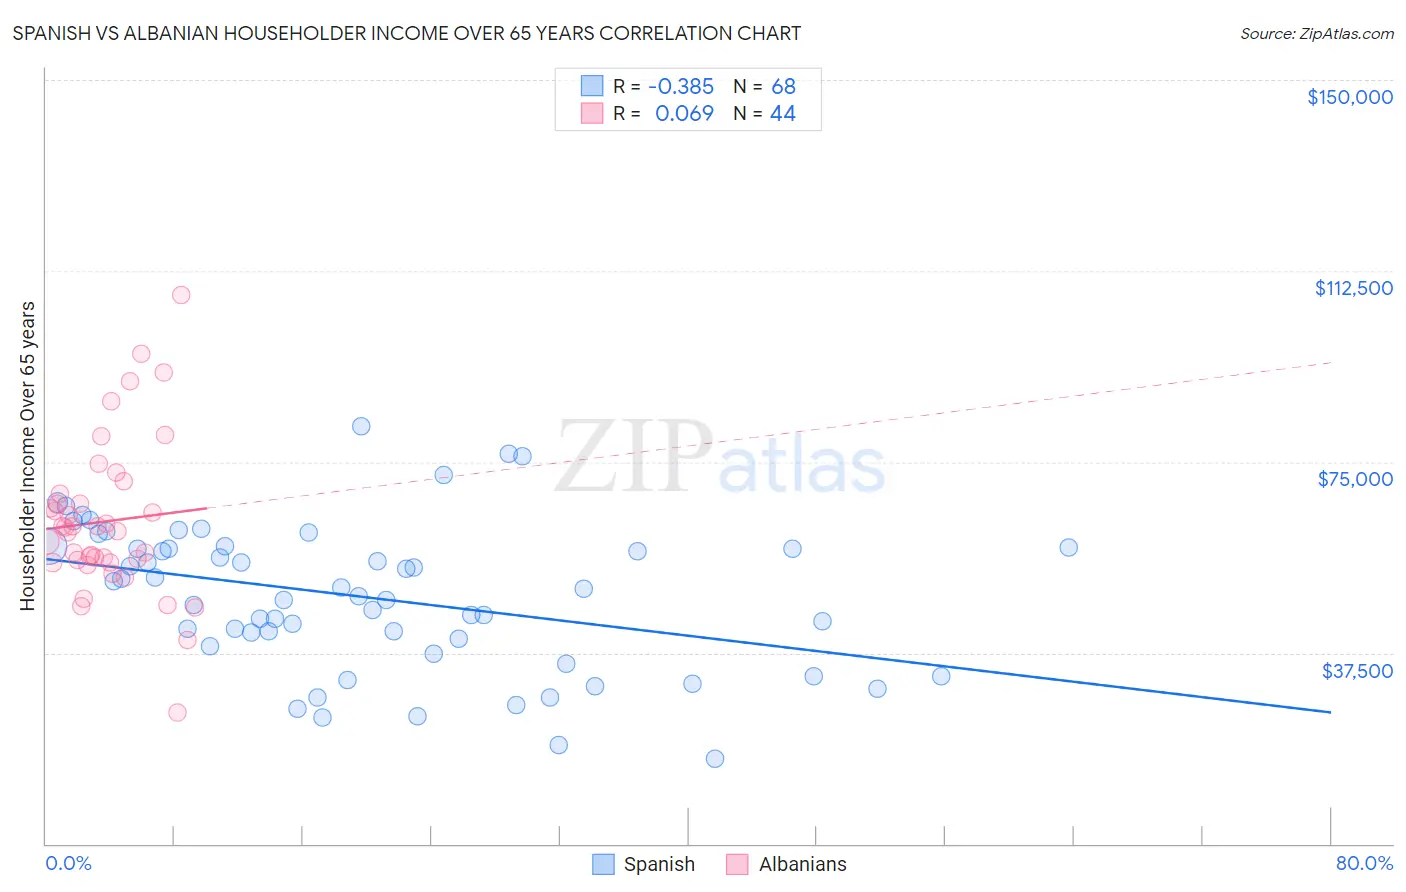
Spanish vs Albanian Householder Income Over 65 years Correlation Chart
The statistical analysis conducted on geographies consisting of 420,502,206 people shows a mild negative correlation between the proportion of Spanish and household income with householder over the age of 65 in the United States with a correlation coefficient (R) of -0.385 and weighted average of $60,795. Similarly, the statistical analysis conducted on geographies consisting of 192,894,684 people shows a slight positive correlation between the proportion of Albanians and household income with householder over the age of 65 in the United States with a correlation coefficient (R) of 0.069 and weighted average of $60,249, a difference of 0.91%.
Householder Income Over 65 years Correlation Summary
| Measurement | Spanish | Albanian |
| Minimum | $16,667 | $25,833 |
| Maximum | $82,000 | $107,661 |
| Range | $65,333 | $81,828 |
| Mean | $48,467 | $63,338 |
| Median | $49,353 | $61,807 |
| Interquartile 25% (IQ1) | $39,610 | $55,515 |
| Interquartile 75% (IQ3) | $58,143 | $67,768 |
| Interquartile Range (IQR) | $18,533 | $12,253 |
| Standard Deviation (Sample) | $14,290 | $15,246 |
| Standard Deviation (Population) | $14,184 | $15,071 |
Demographics Similar to Spanish and Albanians by Householder Income Over 65 years
In terms of householder income over 65 years, the demographic groups most similar to Spanish are Alaska Native ($60,748, a difference of 0.080%), Yup'ik ($60,727, a difference of 0.11%), Spaniard ($60,866, a difference of 0.12%), Welsh ($60,666, a difference of 0.21%), and Immigrants from Morocco ($60,647, a difference of 0.24%). Similarly, the demographic groups most similar to Albanians are Slovene ($60,241, a difference of 0.010%), Immigrants from Thailand ($60,217, a difference of 0.050%), Immigrants from Eritrea ($60,096, a difference of 0.26%), Ghanaian ($60,043, a difference of 0.34%), and Iraqi ($60,466, a difference of 0.36%).
| Demographics | Rating | Rank | Householder Income Over 65 years |
| Serbians | 53.1 /100 | #170 | Average $61,087 |
| Inupiat | 52.4 /100 | #171 | Average $61,061 |
| Immigrants | Poland | 51.9 /100 | #172 | Average $61,041 |
| Immigrants | Micronesia | 50.8 /100 | #173 | Average $61,000 |
| Luxembourgers | 50.0 /100 | #174 | Average $60,967 |
| Spaniards | 47.3 /100 | #175 | Average $60,866 |
| Spanish | 45.5 /100 | #176 | Average $60,795 |
| Alaska Natives | 44.3 /100 | #177 | Average $60,748 |
| Yup'ik | 43.7 /100 | #178 | Average $60,727 |
| Welsh | 42.2 /100 | #179 | Average $60,666 |
| Immigrants | Morocco | 41.7 /100 | #180 | Average $60,647 |
| Celtics | 40.7 /100 | #181 | Average $60,608 |
| Czechoslovakians | 40.0 /100 | #182 | Average $60,581 |
| Kenyans | 38.4 /100 | #183 | Fair $60,514 |
| Iraqis | 37.2 /100 | #184 | Fair $60,466 |
| Albanians | 32.0 /100 | #185 | Fair $60,249 |
| Slovenes | 31.8 /100 | #186 | Fair $60,241 |
| Immigrants | Thailand | 31.3 /100 | #187 | Fair $60,217 |
| Immigrants | Eritrea | 28.6 /100 | #188 | Fair $60,096 |
| Ghanaians | 27.5 /100 | #189 | Fair $60,043 |
| Puget Sound Salish | 25.3 /100 | #190 | Fair $59,934 |