Laotian vs British West Indian Householder Income Over 65 years
COMPARE
Laotian
British West Indian
Householder Income Over 65 years
Householder Income Over 65 years Comparison
Laotians
British West Indians
$66,306
HOUSEHOLDER INCOME OVER 65 YEARS
99.6/ 100
METRIC RATING
56th/ 347
METRIC RANK
$51,463
HOUSEHOLDER INCOME OVER 65 YEARS
0.0/ 100
METRIC RATING
322nd/ 347
METRIC RANK
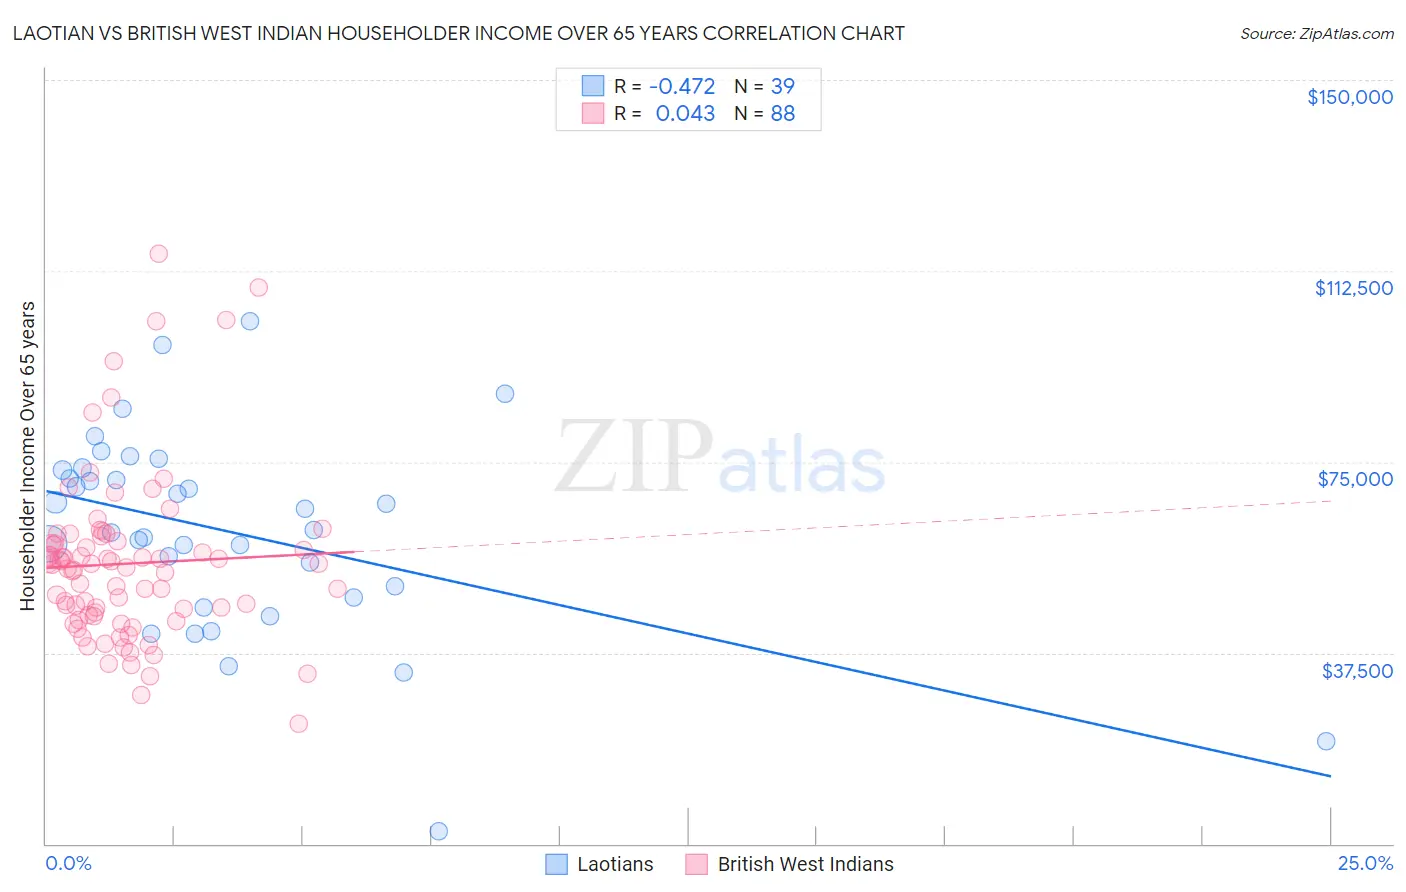
Laotian vs British West Indian Householder Income Over 65 years Correlation Chart
The statistical analysis conducted on geographies consisting of 224,427,715 people shows a moderate negative correlation between the proportion of Laotians and household income with householder over the age of 65 in the United States with a correlation coefficient (R) of -0.472 and weighted average of $66,306. Similarly, the statistical analysis conducted on geographies consisting of 152,278,159 people shows no correlation between the proportion of British West Indians and household income with householder over the age of 65 in the United States with a correlation coefficient (R) of 0.043 and weighted average of $51,463, a difference of 28.8%.
Householder Income Over 65 years Correlation Summary
| Measurement | Laotian | British West Indian |
| Minimum | $2,499 | $23,659 |
| Maximum | $102,679 | $115,893 |
| Range | $100,180 | $92,234 |
| Mean | $61,254 | $54,999 |
| Median | $61,648 | $54,565 |
| Interquartile 25% (IQ1) | $48,484 | $44,759 |
| Interquartile 75% (IQ3) | $73,311 | $59,250 |
| Interquartile Range (IQR) | $24,827 | $14,491 |
| Standard Deviation (Sample) | $19,839 | $16,629 |
| Standard Deviation (Population) | $19,583 | $16,534 |
Similar Demographics by Householder Income Over 65 years
Demographics Similar to Laotians by Householder Income Over 65 years
In terms of householder income over 65 years, the demographic groups most similar to Laotians are Immigrants from Czechoslovakia ($66,376, a difference of 0.11%), Bulgarian ($66,236, a difference of 0.11%), Immigrants from Philippines ($66,161, a difference of 0.22%), Immigrants from Netherlands ($66,463, a difference of 0.24%), and Immigrants from Norway ($66,118, a difference of 0.28%).
| Demographics | Rating | Rank | Householder Income Over 65 years |
| Immigrants | Indonesia | 99.8 /100 | #49 | Exceptional $66,694 |
| Immigrants | Turkey | 99.7 /100 | #50 | Exceptional $66,672 |
| Israelis | 99.7 /100 | #51 | Exceptional $66,636 |
| Immigrants | Scotland | 99.7 /100 | #52 | Exceptional $66,620 |
| Immigrants | Pakistan | 99.7 /100 | #53 | Exceptional $66,617 |
| Immigrants | Netherlands | 99.7 /100 | #54 | Exceptional $66,463 |
| Immigrants | Czechoslovakia | 99.7 /100 | #55 | Exceptional $66,376 |
| Laotians | 99.6 /100 | #56 | Exceptional $66,306 |
| Bulgarians | 99.6 /100 | #57 | Exceptional $66,236 |
| Immigrants | Philippines | 99.6 /100 | #58 | Exceptional $66,161 |
| Immigrants | Norway | 99.5 /100 | #59 | Exceptional $66,118 |
| Immigrants | Lithuania | 99.5 /100 | #60 | Exceptional $66,087 |
| Maltese | 99.5 /100 | #61 | Exceptional $66,027 |
| Immigrants | Sierra Leone | 99.5 /100 | #62 | Exceptional $66,009 |
| Marshallese | 99.4 /100 | #63 | Exceptional $65,874 |
Demographics Similar to British West Indians by Householder Income Over 65 years
In terms of householder income over 65 years, the demographic groups most similar to British West Indians are Cajun ($51,397, a difference of 0.13%), Immigrants from Congo ($51,393, a difference of 0.13%), Immigrants from Haiti ($51,219, a difference of 0.47%), Menominee ($51,719, a difference of 0.50%), and Colville ($51,739, a difference of 0.54%).
| Demographics | Rating | Rank | Householder Income Over 65 years |
| U.S. Virgin Islanders | 0.0 /100 | #315 | Tragic $52,072 |
| Creek | 0.0 /100 | #316 | Tragic $51,949 |
| Immigrants | St. Vincent and the Grenadines | 0.0 /100 | #317 | Tragic $51,922 |
| Haitians | 0.0 /100 | #318 | Tragic $51,912 |
| Immigrants | Honduras | 0.0 /100 | #319 | Tragic $51,888 |
| Colville | 0.0 /100 | #320 | Tragic $51,739 |
| Menominee | 0.0 /100 | #321 | Tragic $51,719 |
| British West Indians | 0.0 /100 | #322 | Tragic $51,463 |
| Cajuns | 0.0 /100 | #323 | Tragic $51,397 |
| Immigrants | Congo | 0.0 /100 | #324 | Tragic $51,393 |
| Immigrants | Haiti | 0.0 /100 | #325 | Tragic $51,219 |
| Kiowa | 0.0 /100 | #326 | Tragic $51,140 |
| Bahamians | 0.0 /100 | #327 | Tragic $51,000 |
| Hopi | 0.0 /100 | #328 | Tragic $50,925 |
| Blacks/African Americans | 0.0 /100 | #329 | Tragic $50,779 |