Puerto Rican vs British West Indian Householder Income Over 65 years
COMPARE
Puerto Rican
British West Indian
Householder Income Over 65 years
Householder Income Over 65 years Comparison
Puerto Ricans
British West Indians
$42,550
HOUSEHOLDER INCOME OVER 65 YEARS
0.0/ 100
METRIC RATING
346th/ 347
METRIC RANK
$51,463
HOUSEHOLDER INCOME OVER 65 YEARS
0.0/ 100
METRIC RATING
322nd/ 347
METRIC RANK
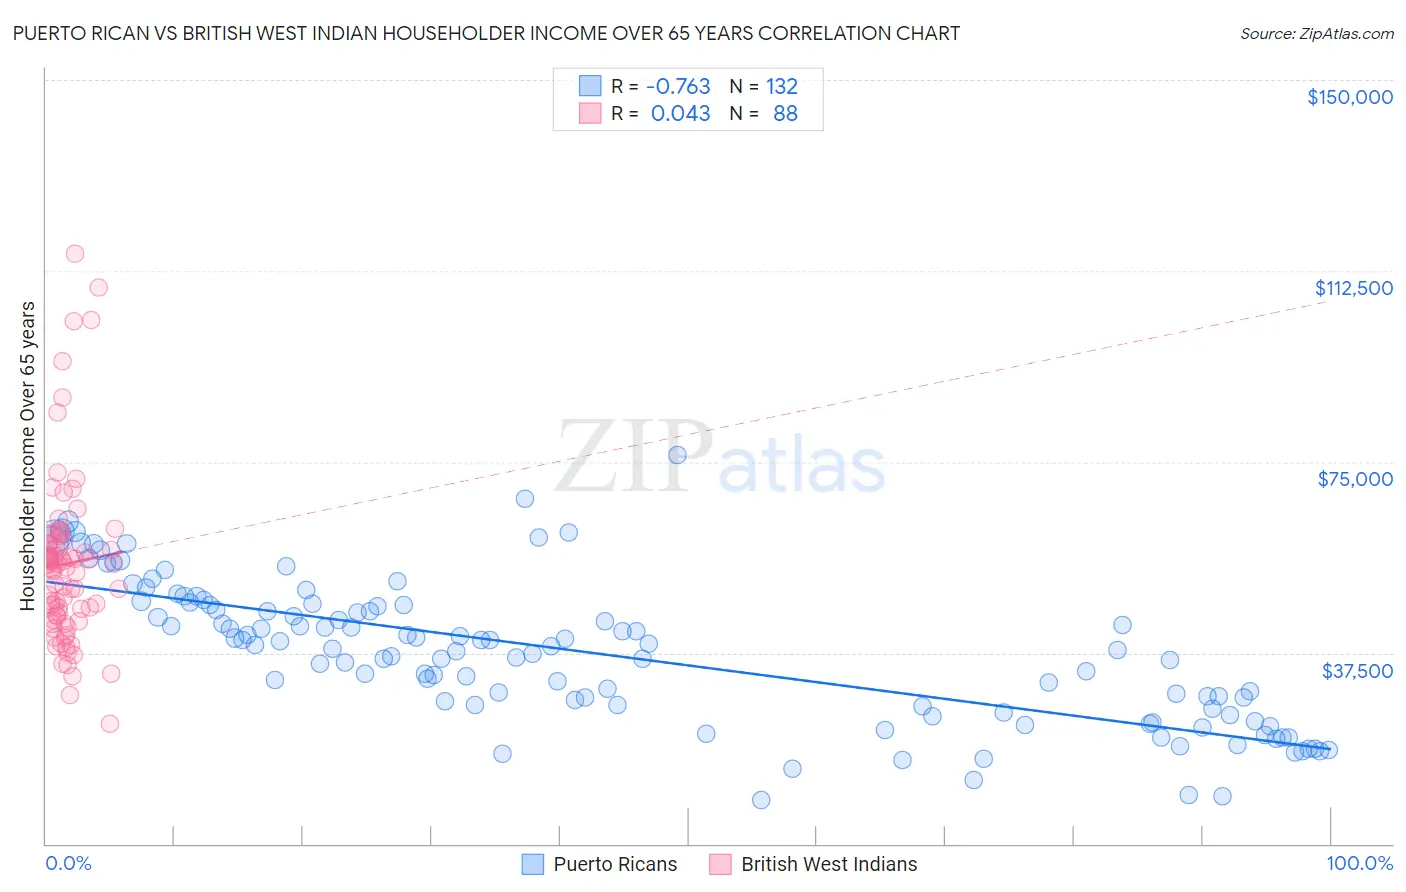
Puerto Rican vs British West Indian Householder Income Over 65 years Correlation Chart
The statistical analysis conducted on geographies consisting of 524,809,203 people shows a strong negative correlation between the proportion of Puerto Ricans and household income with householder over the age of 65 in the United States with a correlation coefficient (R) of -0.763 and weighted average of $42,550. Similarly, the statistical analysis conducted on geographies consisting of 152,278,159 people shows no correlation between the proportion of British West Indians and household income with householder over the age of 65 in the United States with a correlation coefficient (R) of 0.043 and weighted average of $51,463, a difference of 20.9%.
Householder Income Over 65 years Correlation Summary
| Measurement | Puerto Rican | British West Indian |
| Minimum | $8,529 | $23,659 |
| Maximum | $76,277 | $115,893 |
| Range | $67,748 | $92,234 |
| Mean | $37,319 | $54,999 |
| Median | $38,145 | $54,565 |
| Interquartile 25% (IQ1) | $26,777 | $44,759 |
| Interquartile 75% (IQ3) | $46,716 | $59,250 |
| Interquartile Range (IQR) | $19,939 | $14,491 |
| Standard Deviation (Sample) | $13,872 | $16,629 |
| Standard Deviation (Population) | $13,820 | $16,534 |
Similar Demographics by Householder Income Over 65 years
Demographics Similar to Puerto Ricans by Householder Income Over 65 years
In terms of householder income over 65 years, the demographic groups most similar to Puerto Ricans are Lumbee ($40,550, a difference of 4.9%), Immigrants from Cuba ($44,735, a difference of 5.1%), Houma ($44,822, a difference of 5.3%), Immigrants from Dominican Republic ($45,758, a difference of 7.5%), and Immigrants from Cabo Verde ($46,654, a difference of 9.7%).
| Demographics | Rating | Rank | Householder Income Over 65 years |
| Cape Verdeans | 0.0 /100 | #333 | Tragic $50,077 |
| Immigrants | Dominica | 0.0 /100 | #334 | Tragic $50,071 |
| Crow | 0.0 /100 | #335 | Tragic $49,234 |
| Cubans | 0.0 /100 | #336 | Tragic $49,152 |
| Tohono O'odham | 0.0 /100 | #337 | Tragic $49,121 |
| Immigrants | Caribbean | 0.0 /100 | #338 | Tragic $48,535 |
| Navajo | 0.0 /100 | #339 | Tragic $47,722 |
| Immigrants | Yemen | 0.0 /100 | #340 | Tragic $47,527 |
| Dominicans | 0.0 /100 | #341 | Tragic $46,964 |
| Immigrants | Cabo Verde | 0.0 /100 | #342 | Tragic $46,654 |
| Immigrants | Dominican Republic | 0.0 /100 | #343 | Tragic $45,758 |
| Houma | 0.0 /100 | #344 | Tragic $44,822 |
| Immigrants | Cuba | 0.0 /100 | #345 | Tragic $44,735 |
| Puerto Ricans | 0.0 /100 | #346 | Tragic $42,550 |
| Lumbee | 0.0 /100 | #347 | Tragic $40,550 |
Demographics Similar to British West Indians by Householder Income Over 65 years
In terms of householder income over 65 years, the demographic groups most similar to British West Indians are Cajun ($51,397, a difference of 0.13%), Immigrants from Congo ($51,393, a difference of 0.13%), Immigrants from Haiti ($51,219, a difference of 0.47%), Menominee ($51,719, a difference of 0.50%), and Colville ($51,739, a difference of 0.54%).
| Demographics | Rating | Rank | Householder Income Over 65 years |
| U.S. Virgin Islanders | 0.0 /100 | #315 | Tragic $52,072 |
| Creek | 0.0 /100 | #316 | Tragic $51,949 |
| Immigrants | St. Vincent and the Grenadines | 0.0 /100 | #317 | Tragic $51,922 |
| Haitians | 0.0 /100 | #318 | Tragic $51,912 |
| Immigrants | Honduras | 0.0 /100 | #319 | Tragic $51,888 |
| Colville | 0.0 /100 | #320 | Tragic $51,739 |
| Menominee | 0.0 /100 | #321 | Tragic $51,719 |
| British West Indians | 0.0 /100 | #322 | Tragic $51,463 |
| Cajuns | 0.0 /100 | #323 | Tragic $51,397 |
| Immigrants | Congo | 0.0 /100 | #324 | Tragic $51,393 |
| Immigrants | Haiti | 0.0 /100 | #325 | Tragic $51,219 |
| Kiowa | 0.0 /100 | #326 | Tragic $51,140 |
| Bahamians | 0.0 /100 | #327 | Tragic $51,000 |
| Hopi | 0.0 /100 | #328 | Tragic $50,925 |
| Blacks/African Americans | 0.0 /100 | #329 | Tragic $50,779 |