Spanish American vs Okinawan Median Male Earnings
COMPARE
Spanish American
Okinawan
Median Male Earnings
Median Male Earnings Comparison
Spanish Americans
Okinawans
$49,008
MEDIAN MALE EARNINGS
0.5/ 100
METRIC RATING
267th/ 347
METRIC RANK
$67,232
MEDIAN MALE EARNINGS
100.0/ 100
METRIC RATING
14th/ 347
METRIC RANK
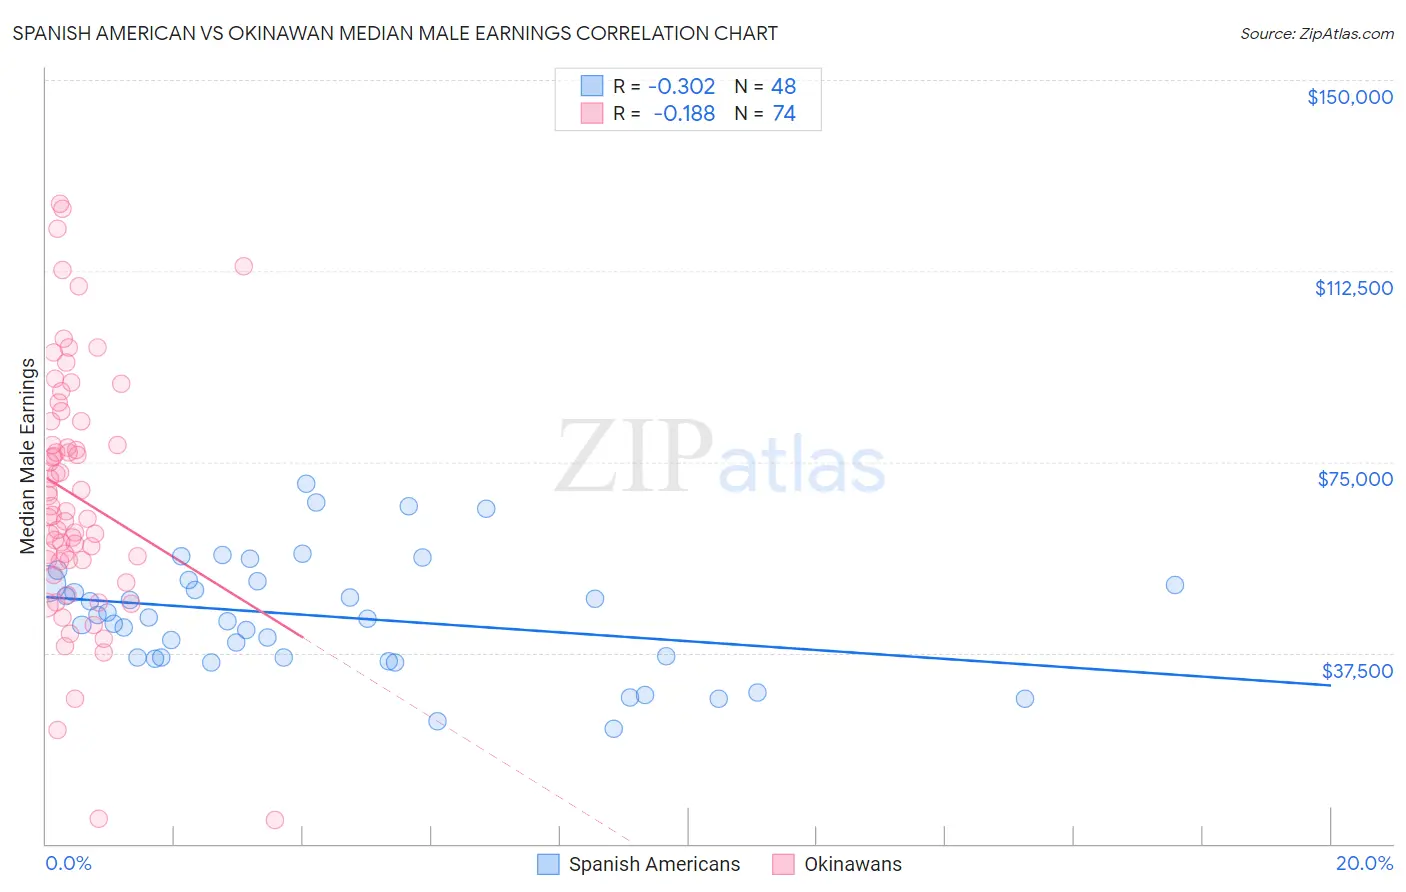
Spanish American vs Okinawan Median Male Earnings Correlation Chart
The statistical analysis conducted on geographies consisting of 103,156,664 people shows a mild negative correlation between the proportion of Spanish Americans and median male earnings in the United States with a correlation coefficient (R) of -0.302 and weighted average of $49,008. Similarly, the statistical analysis conducted on geographies consisting of 73,732,782 people shows a poor negative correlation between the proportion of Okinawans and median male earnings in the United States with a correlation coefficient (R) of -0.188 and weighted average of $67,232, a difference of 37.2%.
Median Male Earnings Correlation Summary
| Measurement | Spanish American | Okinawan |
| Minimum | $22,500 | $4,698 |
| Maximum | $70,678 | $125,733 |
| Range | $48,178 | $121,035 |
| Mean | $44,710 | $68,280 |
| Median | $44,270 | $64,869 |
| Interquartile 25% (IQ1) | $36,560 | $55,642 |
| Interquartile 75% (IQ3) | $51,208 | $83,017 |
| Interquartile Range (IQR) | $14,648 | $27,375 |
| Standard Deviation (Sample) | $11,259 | $24,436 |
| Standard Deviation (Population) | $11,141 | $24,270 |
Similar Demographics by Median Male Earnings
Demographics Similar to Spanish Americans by Median Male Earnings
In terms of median male earnings, the demographic groups most similar to Spanish Americans are Somali ($49,025, a difference of 0.040%), Ute ($48,899, a difference of 0.22%), Tsimshian ($48,836, a difference of 0.35%), Immigrants from Laos ($49,190, a difference of 0.37%), and Immigrants from Middle Africa ($49,201, a difference of 0.39%).
| Demographics | Rating | Rank | Median Male Earnings |
| Iroquois | 0.7 /100 | #260 | Tragic $49,374 |
| Liberians | 0.6 /100 | #261 | Tragic $49,318 |
| Immigrants | West Indies | 0.6 /100 | #262 | Tragic $49,271 |
| Nicaraguans | 0.6 /100 | #263 | Tragic $49,215 |
| Immigrants | Middle Africa | 0.6 /100 | #264 | Tragic $49,201 |
| Immigrants | Laos | 0.6 /100 | #265 | Tragic $49,190 |
| Somalis | 0.5 /100 | #266 | Tragic $49,025 |
| Spanish Americans | 0.5 /100 | #267 | Tragic $49,008 |
| Ute | 0.4 /100 | #268 | Tragic $48,899 |
| Tsimshian | 0.4 /100 | #269 | Tragic $48,836 |
| Potawatomi | 0.4 /100 | #270 | Tragic $48,768 |
| Cherokee | 0.3 /100 | #271 | Tragic $48,669 |
| Salvadorans | 0.3 /100 | #272 | Tragic $48,646 |
| Jamaicans | 0.3 /100 | #273 | Tragic $48,632 |
| Colville | 0.3 /100 | #274 | Tragic $48,516 |
Demographics Similar to Okinawans by Median Male Earnings
In terms of median male earnings, the demographic groups most similar to Okinawans are Immigrants from China ($67,353, a difference of 0.18%), Immigrants from Eastern Asia ($66,903, a difference of 0.49%), Immigrants from Australia ($67,634, a difference of 0.60%), Immigrants from Ireland ($67,698, a difference of 0.69%), and Eastern European ($66,472, a difference of 1.1%).
| Demographics | Rating | Rank | Median Male Earnings |
| Immigrants | Hong Kong | 100.0 /100 | #7 | Exceptional $70,146 |
| Immigrants | Iran | 100.0 /100 | #8 | Exceptional $69,284 |
| Immigrants | South Central Asia | 100.0 /100 | #9 | Exceptional $68,960 |
| Immigrants | Israel | 100.0 /100 | #10 | Exceptional $68,716 |
| Immigrants | Ireland | 100.0 /100 | #11 | Exceptional $67,698 |
| Immigrants | Australia | 100.0 /100 | #12 | Exceptional $67,634 |
| Immigrants | China | 100.0 /100 | #13 | Exceptional $67,353 |
| Okinawans | 100.0 /100 | #14 | Exceptional $67,232 |
| Immigrants | Eastern Asia | 100.0 /100 | #15 | Exceptional $66,903 |
| Eastern Europeans | 100.0 /100 | #16 | Exceptional $66,472 |
| Immigrants | Belgium | 100.0 /100 | #17 | Exceptional $66,125 |
| Indians (Asian) | 100.0 /100 | #18 | Exceptional $66,078 |
| Cypriots | 100.0 /100 | #19 | Exceptional $65,549 |
| Immigrants | Japan | 100.0 /100 | #20 | Exceptional $65,518 |
| Immigrants | Sweden | 100.0 /100 | #21 | Exceptional $65,406 |