Spanish American vs Immigrants from Austria Median Male Earnings
COMPARE
Spanish American
Immigrants from Austria
Median Male Earnings
Median Male Earnings Comparison
Spanish Americans
Immigrants from Austria
$49,008
MEDIAN MALE EARNINGS
0.5/ 100
METRIC RATING
267th/ 347
METRIC RANK
$62,164
MEDIAN MALE EARNINGS
99.9/ 100
METRIC RATING
47th/ 347
METRIC RANK
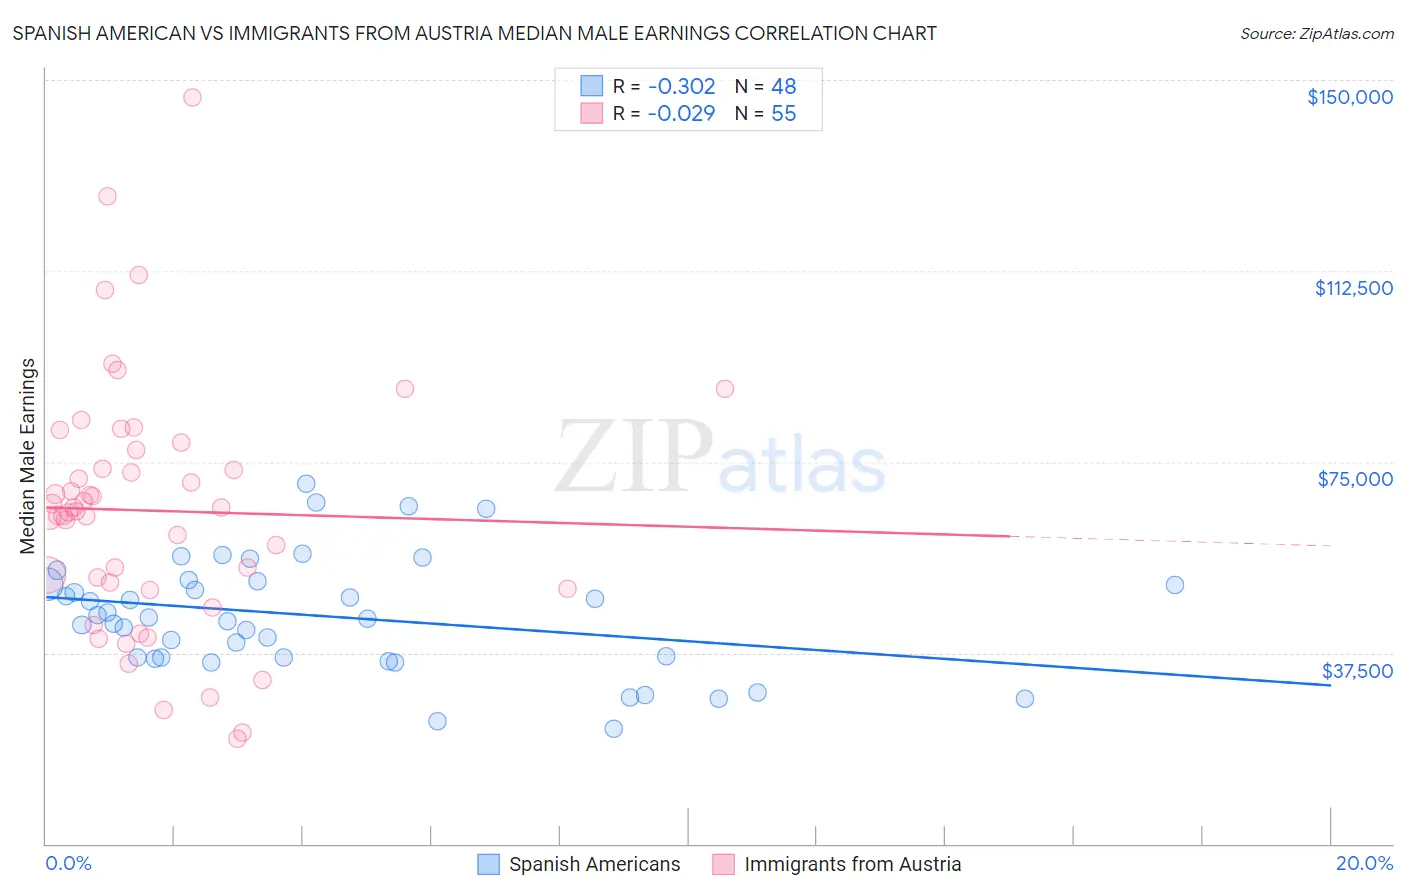
Spanish American vs Immigrants from Austria Median Male Earnings Correlation Chart
The statistical analysis conducted on geographies consisting of 103,156,664 people shows a mild negative correlation between the proportion of Spanish Americans and median male earnings in the United States with a correlation coefficient (R) of -0.302 and weighted average of $49,008. Similarly, the statistical analysis conducted on geographies consisting of 167,941,701 people shows no correlation between the proportion of Immigrants from Austria and median male earnings in the United States with a correlation coefficient (R) of -0.029 and weighted average of $62,164, a difference of 26.8%.
Median Male Earnings Correlation Summary
| Measurement | Spanish American | Immigrants from Austria |
| Minimum | $22,500 | $20,568 |
| Maximum | $70,678 | $146,444 |
| Range | $48,178 | $125,876 |
| Mean | $44,710 | $65,411 |
| Median | $44,270 | $65,258 |
| Interquartile 25% (IQ1) | $36,560 | $50,000 |
| Interquartile 75% (IQ3) | $51,208 | $77,315 |
| Interquartile Range (IQR) | $14,648 | $27,315 |
| Standard Deviation (Sample) | $11,259 | $24,493 |
| Standard Deviation (Population) | $11,141 | $24,269 |
Similar Demographics by Median Male Earnings
Demographics Similar to Spanish Americans by Median Male Earnings
In terms of median male earnings, the demographic groups most similar to Spanish Americans are Somali ($49,025, a difference of 0.040%), Ute ($48,899, a difference of 0.22%), Tsimshian ($48,836, a difference of 0.35%), Immigrants from Laos ($49,190, a difference of 0.37%), and Immigrants from Middle Africa ($49,201, a difference of 0.39%).
| Demographics | Rating | Rank | Median Male Earnings |
| Iroquois | 0.7 /100 | #260 | Tragic $49,374 |
| Liberians | 0.6 /100 | #261 | Tragic $49,318 |
| Immigrants | West Indies | 0.6 /100 | #262 | Tragic $49,271 |
| Nicaraguans | 0.6 /100 | #263 | Tragic $49,215 |
| Immigrants | Middle Africa | 0.6 /100 | #264 | Tragic $49,201 |
| Immigrants | Laos | 0.6 /100 | #265 | Tragic $49,190 |
| Somalis | 0.5 /100 | #266 | Tragic $49,025 |
| Spanish Americans | 0.5 /100 | #267 | Tragic $49,008 |
| Ute | 0.4 /100 | #268 | Tragic $48,899 |
| Tsimshian | 0.4 /100 | #269 | Tragic $48,836 |
| Potawatomi | 0.4 /100 | #270 | Tragic $48,768 |
| Cherokee | 0.3 /100 | #271 | Tragic $48,669 |
| Salvadorans | 0.3 /100 | #272 | Tragic $48,646 |
| Jamaicans | 0.3 /100 | #273 | Tragic $48,632 |
| Colville | 0.3 /100 | #274 | Tragic $48,516 |
Demographics Similar to Immigrants from Austria by Median Male Earnings
In terms of median male earnings, the demographic groups most similar to Immigrants from Austria are Immigrants from Malaysia ($62,121, a difference of 0.070%), Immigrants from Czechoslovakia ($62,217, a difference of 0.090%), Immigrants from Europe ($62,057, a difference of 0.17%), Bulgarian ($62,378, a difference of 0.35%), and Cambodian ($62,516, a difference of 0.57%).
| Demographics | Rating | Rank | Median Male Earnings |
| Australians | 100.0 /100 | #40 | Exceptional $62,857 |
| Immigrants | Turkey | 100.0 /100 | #41 | Exceptional $62,728 |
| Immigrants | Greece | 100.0 /100 | #42 | Exceptional $62,689 |
| Immigrants | Belarus | 100.0 /100 | #43 | Exceptional $62,658 |
| Cambodians | 100.0 /100 | #44 | Exceptional $62,516 |
| Bulgarians | 100.0 /100 | #45 | Exceptional $62,378 |
| Immigrants | Czechoslovakia | 99.9 /100 | #46 | Exceptional $62,217 |
| Immigrants | Austria | 99.9 /100 | #47 | Exceptional $62,164 |
| Immigrants | Malaysia | 99.9 /100 | #48 | Exceptional $62,121 |
| Immigrants | Europe | 99.9 /100 | #49 | Exceptional $62,057 |
| Bhutanese | 99.9 /100 | #50 | Exceptional $61,759 |
| Estonians | 99.9 /100 | #51 | Exceptional $61,710 |
| Immigrants | Norway | 99.9 /100 | #52 | Exceptional $61,628 |
| South Africans | 99.9 /100 | #53 | Exceptional $61,460 |
| Immigrants | Latvia | 99.9 /100 | #54 | Exceptional $61,422 |