Polish vs Okinawan Median Male Earnings
COMPARE
Polish
Okinawan
Median Male Earnings
Median Male Earnings Comparison
Poles
Okinawans
$58,139
MEDIAN MALE EARNINGS
97.3/ 100
METRIC RATING
103rd/ 347
METRIC RANK
$67,232
MEDIAN MALE EARNINGS
100.0/ 100
METRIC RATING
14th/ 347
METRIC RANK
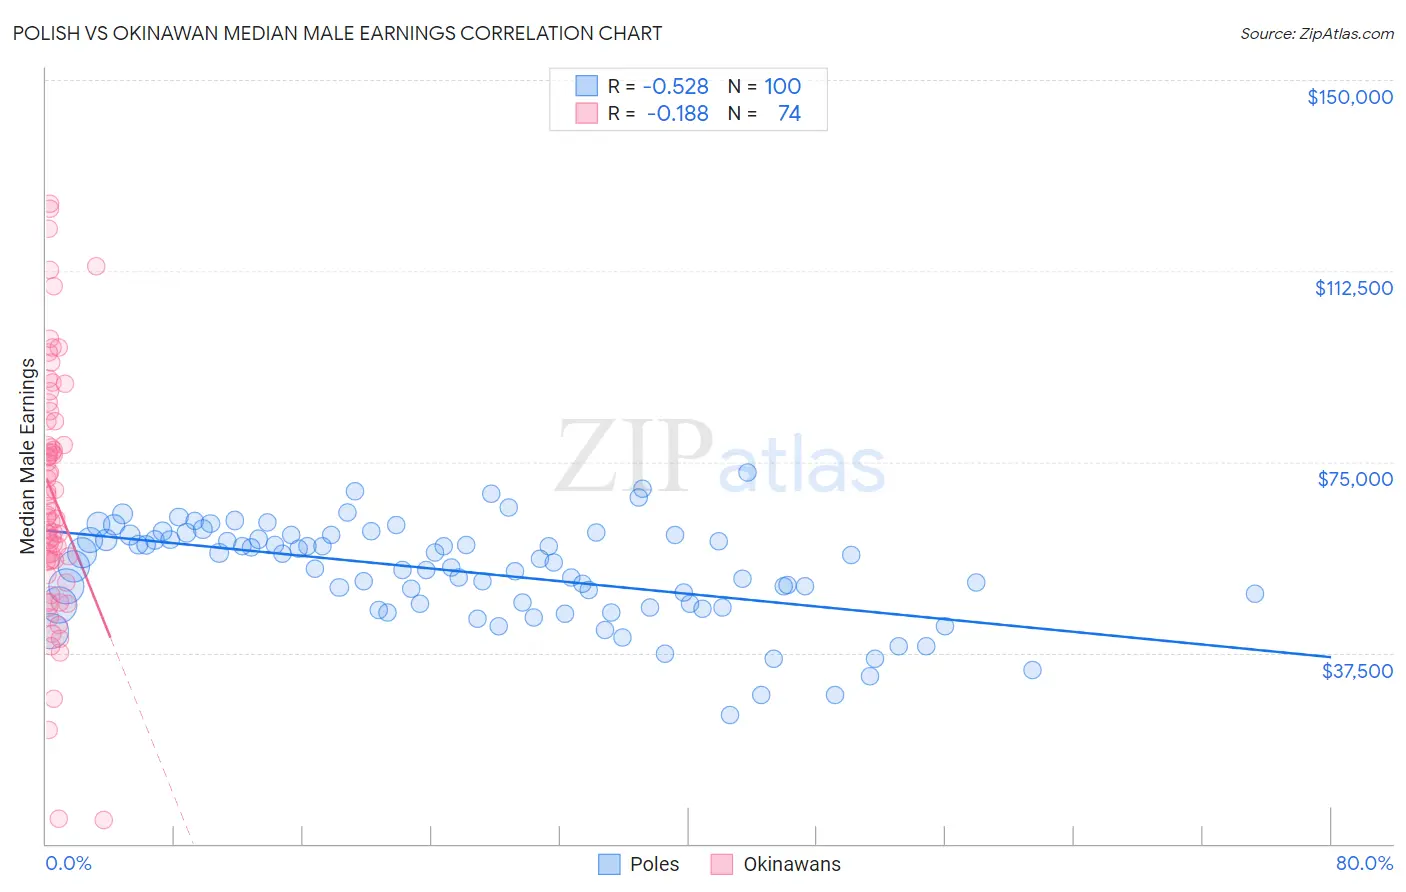
Polish vs Okinawan Median Male Earnings Correlation Chart
The statistical analysis conducted on geographies consisting of 559,585,611 people shows a substantial negative correlation between the proportion of Poles and median male earnings in the United States with a correlation coefficient (R) of -0.528 and weighted average of $58,139. Similarly, the statistical analysis conducted on geographies consisting of 73,732,782 people shows a poor negative correlation between the proportion of Okinawans and median male earnings in the United States with a correlation coefficient (R) of -0.188 and weighted average of $67,232, a difference of 15.6%.
Median Male Earnings Correlation Summary
| Measurement | Polish | Okinawan |
| Minimum | $25,204 | $4,698 |
| Maximum | $72,933 | $125,733 |
| Range | $47,729 | $121,035 |
| Mean | $53,382 | $68,280 |
| Median | $54,879 | $64,869 |
| Interquartile 25% (IQ1) | $46,953 | $55,642 |
| Interquartile 75% (IQ3) | $60,187 | $83,017 |
| Interquartile Range (IQR) | $13,234 | $27,375 |
| Standard Deviation (Sample) | $9,652 | $24,436 |
| Standard Deviation (Population) | $9,604 | $24,270 |
Similar Demographics by Median Male Earnings
Demographics Similar to Poles by Median Male Earnings
In terms of median male earnings, the demographic groups most similar to Poles are Armenian ($58,134, a difference of 0.010%), Immigrants from Western Asia ($58,131, a difference of 0.020%), Syrian ($58,187, a difference of 0.080%), Immigrants from Northern Africa ($58,008, a difference of 0.23%), and Serbian ($57,975, a difference of 0.28%).
| Demographics | Rating | Rank | Median Male Earnings |
| Albanians | 98.4 /100 | #96 | Exceptional $58,680 |
| Northern Europeans | 98.2 /100 | #97 | Exceptional $58,588 |
| Jordanians | 98.1 /100 | #98 | Exceptional $58,500 |
| Immigrants | Poland | 98.0 /100 | #99 | Exceptional $58,452 |
| Assyrians/Chaldeans/Syriacs | 97.9 /100 | #100 | Exceptional $58,437 |
| Immigrants | Brazil | 97.7 /100 | #101 | Exceptional $58,324 |
| Syrians | 97.4 /100 | #102 | Exceptional $58,187 |
| Poles | 97.3 /100 | #103 | Exceptional $58,139 |
| Armenians | 97.3 /100 | #104 | Exceptional $58,134 |
| Immigrants | Western Asia | 97.3 /100 | #105 | Exceptional $58,131 |
| Immigrants | Northern Africa | 96.9 /100 | #106 | Exceptional $58,008 |
| Serbians | 96.8 /100 | #107 | Exceptional $57,975 |
| Immigrants | Uzbekistan | 96.7 /100 | #108 | Exceptional $57,941 |
| British | 96.5 /100 | #109 | Exceptional $57,890 |
| Palestinians | 96.2 /100 | #110 | Exceptional $57,778 |
Demographics Similar to Okinawans by Median Male Earnings
In terms of median male earnings, the demographic groups most similar to Okinawans are Immigrants from China ($67,353, a difference of 0.18%), Immigrants from Eastern Asia ($66,903, a difference of 0.49%), Immigrants from Australia ($67,634, a difference of 0.60%), Immigrants from Ireland ($67,698, a difference of 0.69%), and Eastern European ($66,472, a difference of 1.1%).
| Demographics | Rating | Rank | Median Male Earnings |
| Immigrants | Hong Kong | 100.0 /100 | #7 | Exceptional $70,146 |
| Immigrants | Iran | 100.0 /100 | #8 | Exceptional $69,284 |
| Immigrants | South Central Asia | 100.0 /100 | #9 | Exceptional $68,960 |
| Immigrants | Israel | 100.0 /100 | #10 | Exceptional $68,716 |
| Immigrants | Ireland | 100.0 /100 | #11 | Exceptional $67,698 |
| Immigrants | Australia | 100.0 /100 | #12 | Exceptional $67,634 |
| Immigrants | China | 100.0 /100 | #13 | Exceptional $67,353 |
| Okinawans | 100.0 /100 | #14 | Exceptional $67,232 |
| Immigrants | Eastern Asia | 100.0 /100 | #15 | Exceptional $66,903 |
| Eastern Europeans | 100.0 /100 | #16 | Exceptional $66,472 |
| Immigrants | Belgium | 100.0 /100 | #17 | Exceptional $66,125 |
| Indians (Asian) | 100.0 /100 | #18 | Exceptional $66,078 |
| Cypriots | 100.0 /100 | #19 | Exceptional $65,549 |
| Immigrants | Japan | 100.0 /100 | #20 | Exceptional $65,518 |
| Immigrants | Sweden | 100.0 /100 | #21 | Exceptional $65,406 |