Venezuelan vs Okinawan Median Male Earnings
COMPARE
Venezuelan
Okinawan
Median Male Earnings
Median Male Earnings Comparison
Venezuelans
Okinawans
$52,510
MEDIAN MALE EARNINGS
12.5/ 100
METRIC RATING
208th/ 347
METRIC RANK
$67,232
MEDIAN MALE EARNINGS
100.0/ 100
METRIC RATING
14th/ 347
METRIC RANK
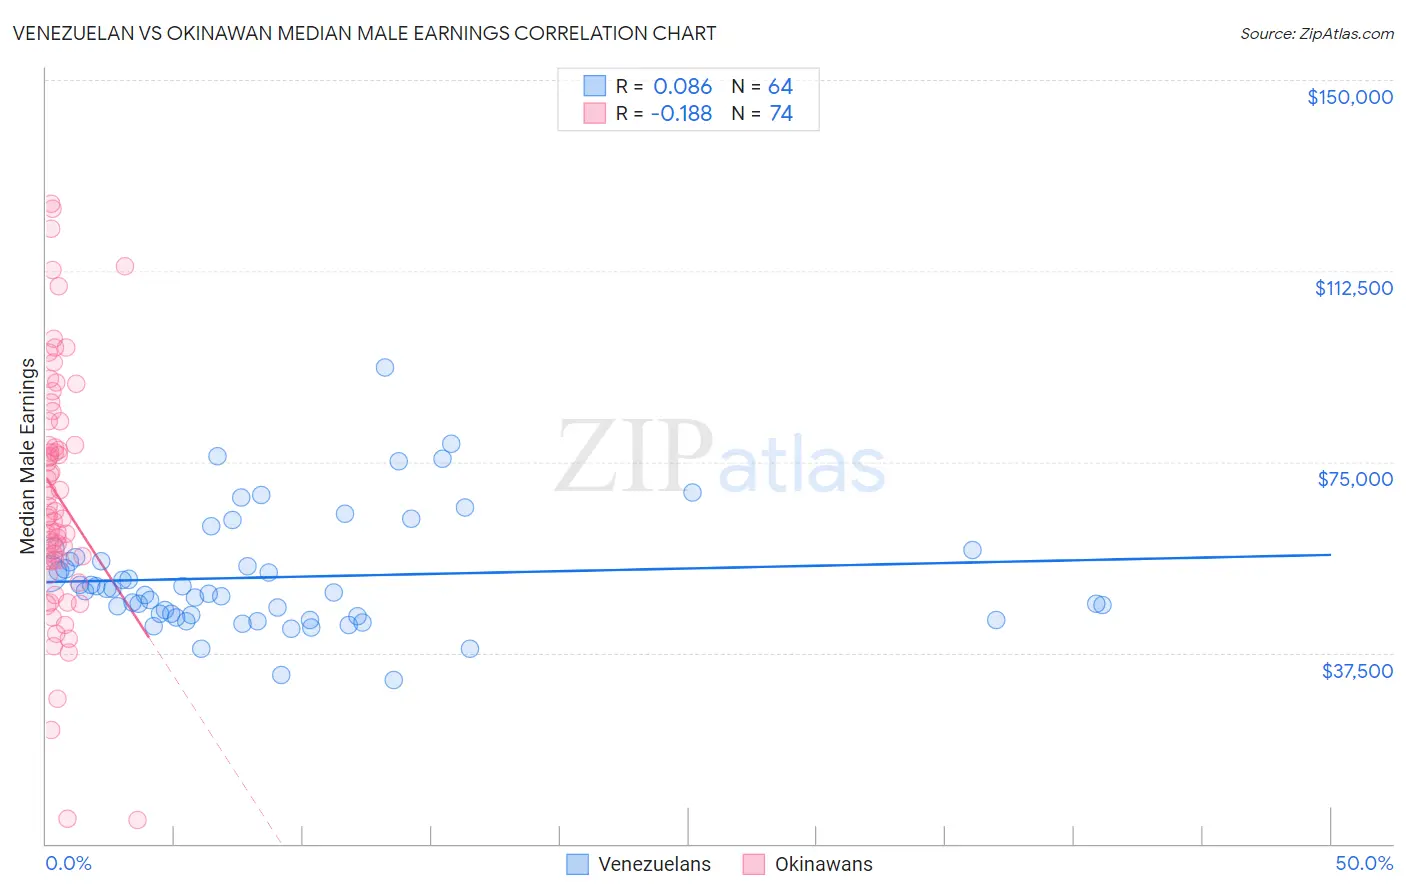
Venezuelan vs Okinawan Median Male Earnings Correlation Chart
The statistical analysis conducted on geographies consisting of 306,273,362 people shows a slight positive correlation between the proportion of Venezuelans and median male earnings in the United States with a correlation coefficient (R) of 0.086 and weighted average of $52,510. Similarly, the statistical analysis conducted on geographies consisting of 73,732,782 people shows a poor negative correlation between the proportion of Okinawans and median male earnings in the United States with a correlation coefficient (R) of -0.188 and weighted average of $67,232, a difference of 28.0%.
Median Male Earnings Correlation Summary
| Measurement | Venezuelan | Okinawan |
| Minimum | $32,054 | $4,698 |
| Maximum | $93,535 | $125,733 |
| Range | $61,481 | $121,035 |
| Mean | $52,370 | $68,280 |
| Median | $49,459 | $64,869 |
| Interquartile 25% (IQ1) | $44,807 | $55,642 |
| Interquartile 75% (IQ3) | $55,925 | $83,017 |
| Interquartile Range (IQR) | $11,117 | $27,375 |
| Standard Deviation (Sample) | $11,420 | $24,436 |
| Standard Deviation (Population) | $11,330 | $24,270 |
Similar Demographics by Median Male Earnings
Demographics Similar to Venezuelans by Median Male Earnings
In terms of median male earnings, the demographic groups most similar to Venezuelans are Vietnamese ($52,525, a difference of 0.030%), Bermudan ($52,465, a difference of 0.090%), Delaware ($52,412, a difference of 0.19%), Tlingit-Haida ($52,409, a difference of 0.19%), and Immigrants from Iraq ($52,681, a difference of 0.33%).
| Demographics | Rating | Rank | Median Male Earnings |
| Immigrants | Bosnia and Herzegovina | 16.9 /100 | #201 | Poor $52,869 |
| Immigrants | Uruguay | 16.8 /100 | #202 | Poor $52,860 |
| Panamanians | 16.5 /100 | #203 | Poor $52,835 |
| Ghanaians | 16.1 /100 | #204 | Poor $52,810 |
| Immigrants | Colombia | 15.0 /100 | #205 | Poor $52,725 |
| Immigrants | Iraq | 14.5 /100 | #206 | Poor $52,681 |
| Vietnamese | 12.7 /100 | #207 | Poor $52,525 |
| Venezuelans | 12.5 /100 | #208 | Poor $52,510 |
| Bermudans | 12.1 /100 | #209 | Poor $52,465 |
| Delaware | 11.5 /100 | #210 | Poor $52,412 |
| Tlingit-Haida | 11.5 /100 | #211 | Poor $52,409 |
| Cajuns | 10.7 /100 | #212 | Poor $52,325 |
| Native Hawaiians | 10.5 /100 | #213 | Poor $52,306 |
| Immigrants | Nonimmigrants | 9.3 /100 | #214 | Tragic $52,170 |
| Immigrants | Cameroon | 8.9 /100 | #215 | Tragic $52,119 |
Demographics Similar to Okinawans by Median Male Earnings
In terms of median male earnings, the demographic groups most similar to Okinawans are Immigrants from China ($67,353, a difference of 0.18%), Immigrants from Eastern Asia ($66,903, a difference of 0.49%), Immigrants from Australia ($67,634, a difference of 0.60%), Immigrants from Ireland ($67,698, a difference of 0.69%), and Eastern European ($66,472, a difference of 1.1%).
| Demographics | Rating | Rank | Median Male Earnings |
| Immigrants | Hong Kong | 100.0 /100 | #7 | Exceptional $70,146 |
| Immigrants | Iran | 100.0 /100 | #8 | Exceptional $69,284 |
| Immigrants | South Central Asia | 100.0 /100 | #9 | Exceptional $68,960 |
| Immigrants | Israel | 100.0 /100 | #10 | Exceptional $68,716 |
| Immigrants | Ireland | 100.0 /100 | #11 | Exceptional $67,698 |
| Immigrants | Australia | 100.0 /100 | #12 | Exceptional $67,634 |
| Immigrants | China | 100.0 /100 | #13 | Exceptional $67,353 |
| Okinawans | 100.0 /100 | #14 | Exceptional $67,232 |
| Immigrants | Eastern Asia | 100.0 /100 | #15 | Exceptional $66,903 |
| Eastern Europeans | 100.0 /100 | #16 | Exceptional $66,472 |
| Immigrants | Belgium | 100.0 /100 | #17 | Exceptional $66,125 |
| Indians (Asian) | 100.0 /100 | #18 | Exceptional $66,078 |
| Cypriots | 100.0 /100 | #19 | Exceptional $65,549 |
| Immigrants | Japan | 100.0 /100 | #20 | Exceptional $65,518 |
| Immigrants | Sweden | 100.0 /100 | #21 | Exceptional $65,406 |