Spanish American vs Immigrants from Laos Median Male Earnings
COMPARE
Spanish American
Immigrants from Laos
Median Male Earnings
Median Male Earnings Comparison
Spanish Americans
Immigrants from Laos
$49,008
MEDIAN MALE EARNINGS
0.5/ 100
METRIC RATING
267th/ 347
METRIC RANK
$49,190
MEDIAN MALE EARNINGS
0.6/ 100
METRIC RATING
265th/ 347
METRIC RANK
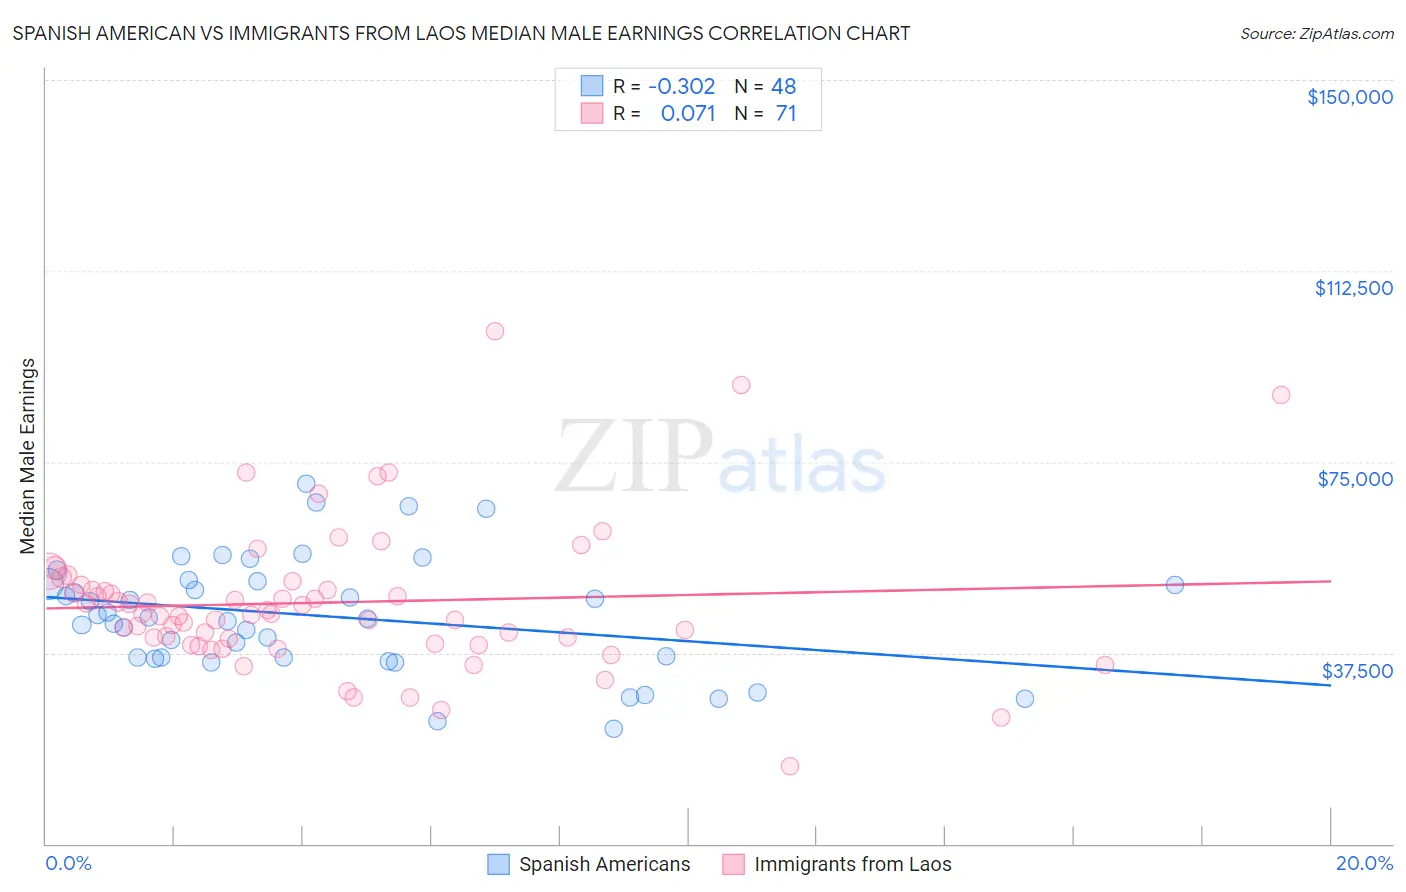
Spanish American vs Immigrants from Laos Median Male Earnings Correlation Chart
The statistical analysis conducted on geographies consisting of 103,156,664 people shows a mild negative correlation between the proportion of Spanish Americans and median male earnings in the United States with a correlation coefficient (R) of -0.302 and weighted average of $49,008. Similarly, the statistical analysis conducted on geographies consisting of 201,459,806 people shows a slight positive correlation between the proportion of Immigrants from Laos and median male earnings in the United States with a correlation coefficient (R) of 0.071 and weighted average of $49,190, a difference of 0.37%.
Median Male Earnings Correlation Summary
| Measurement | Spanish American | Immigrants from Laos |
| Minimum | $22,500 | $15,268 |
| Maximum | $70,678 | $100,625 |
| Range | $48,178 | $85,357 |
| Mean | $44,710 | $47,381 |
| Median | $44,270 | $45,153 |
| Interquartile 25% (IQ1) | $36,560 | $39,274 |
| Interquartile 75% (IQ3) | $51,208 | $50,916 |
| Interquartile Range (IQR) | $14,648 | $11,642 |
| Standard Deviation (Sample) | $11,259 | $14,342 |
| Standard Deviation (Population) | $11,141 | $14,241 |
Demographics Similar to Spanish Americans and Immigrants from Laos by Median Male Earnings
In terms of median male earnings, the demographic groups most similar to Spanish Americans are Somali ($49,025, a difference of 0.040%), Ute ($48,899, a difference of 0.22%), Tsimshian ($48,836, a difference of 0.35%), Immigrants from Middle Africa ($49,201, a difference of 0.39%), and Nicaraguan ($49,215, a difference of 0.42%). Similarly, the demographic groups most similar to Immigrants from Laos are Immigrants from Middle Africa ($49,201, a difference of 0.020%), Nicaraguan ($49,215, a difference of 0.050%), Immigrants from West Indies ($49,271, a difference of 0.16%), Liberian ($49,318, a difference of 0.26%), and Somali ($49,025, a difference of 0.34%).
| Demographics | Rating | Rank | Median Male Earnings |
| Alaska Natives | 0.9 /100 | #256 | Tragic $49,711 |
| British West Indians | 0.8 /100 | #257 | Tragic $49,636 |
| Cree | 0.7 /100 | #258 | Tragic $49,497 |
| Nepalese | 0.7 /100 | #259 | Tragic $49,458 |
| Iroquois | 0.7 /100 | #260 | Tragic $49,374 |
| Liberians | 0.6 /100 | #261 | Tragic $49,318 |
| Immigrants | West Indies | 0.6 /100 | #262 | Tragic $49,271 |
| Nicaraguans | 0.6 /100 | #263 | Tragic $49,215 |
| Immigrants | Middle Africa | 0.6 /100 | #264 | Tragic $49,201 |
| Immigrants | Laos | 0.6 /100 | #265 | Tragic $49,190 |
| Somalis | 0.5 /100 | #266 | Tragic $49,025 |
| Spanish Americans | 0.5 /100 | #267 | Tragic $49,008 |
| Ute | 0.4 /100 | #268 | Tragic $48,899 |
| Tsimshian | 0.4 /100 | #269 | Tragic $48,836 |
| Potawatomi | 0.4 /100 | #270 | Tragic $48,768 |
| Cherokee | 0.3 /100 | #271 | Tragic $48,669 |
| Salvadorans | 0.3 /100 | #272 | Tragic $48,646 |
| Jamaicans | 0.3 /100 | #273 | Tragic $48,632 |
| Colville | 0.3 /100 | #274 | Tragic $48,516 |
| Immigrants | Somalia | 0.3 /100 | #275 | Tragic $48,439 |
| Blackfeet | 0.3 /100 | #276 | Tragic $48,402 |