Spanish American vs Okinawan Professional Degree
COMPARE
Spanish American
Okinawan
Professional Degree
Professional Degree Comparison
Spanish Americans
Okinawans
3.9%
PROFESSIONAL DEGREE
3.8/ 100
METRIC RATING
236th/ 347
METRIC RANK
7.3%
PROFESSIONAL DEGREE
100.0/ 100
METRIC RATING
6th/ 347
METRIC RANK
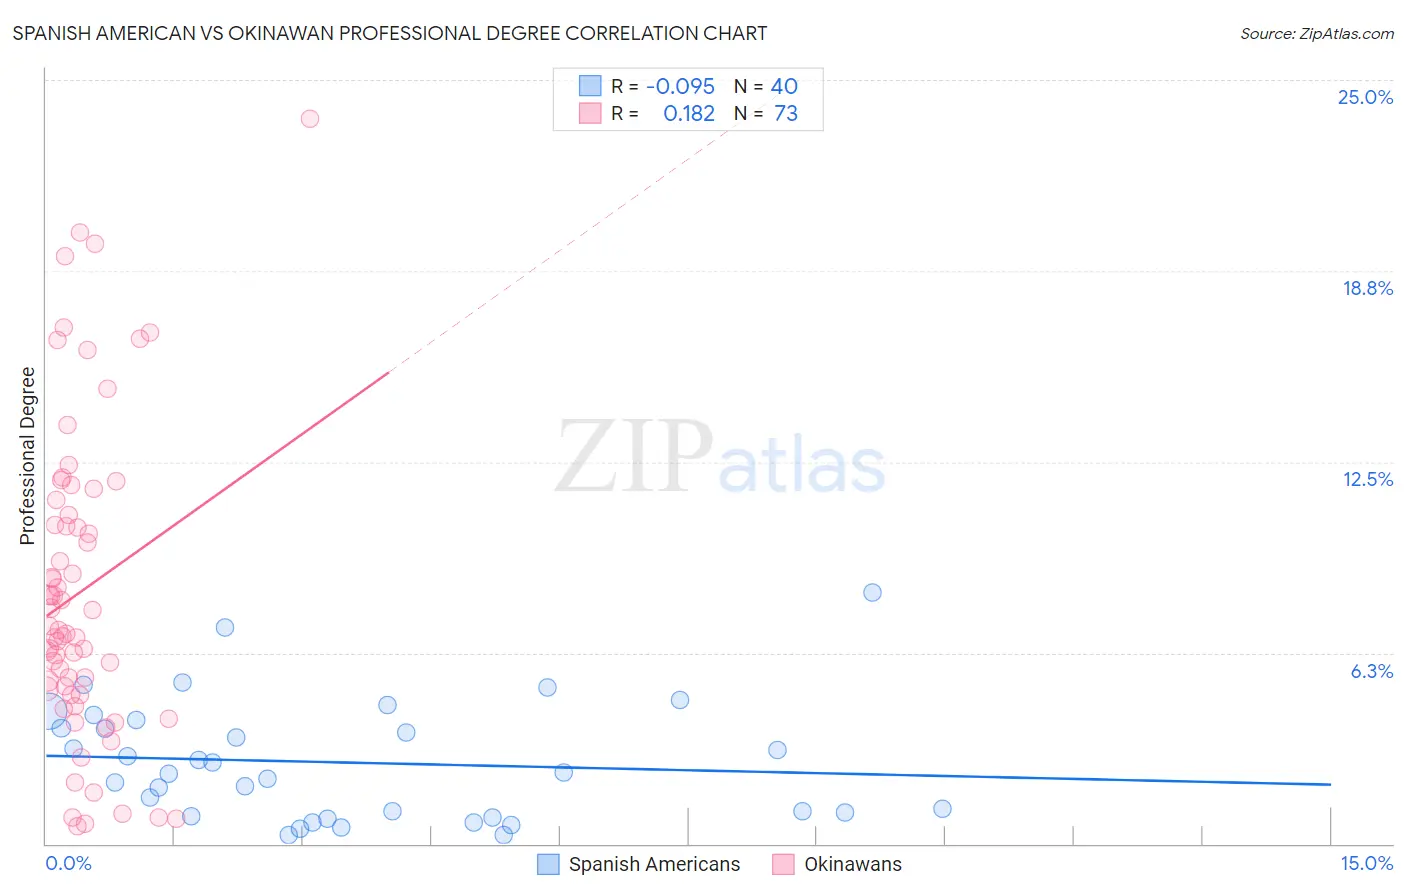
Spanish American vs Okinawan Professional Degree Correlation Chart
The statistical analysis conducted on geographies consisting of 103,063,360 people shows a slight negative correlation between the proportion of Spanish Americans and percentage of population with at least professional degree education in the United States with a correlation coefficient (R) of -0.095 and weighted average of 3.9%. Similarly, the statistical analysis conducted on geographies consisting of 73,726,679 people shows a poor positive correlation between the proportion of Okinawans and percentage of population with at least professional degree education in the United States with a correlation coefficient (R) of 0.182 and weighted average of 7.3%, a difference of 88.1%.
Professional Degree Correlation Summary
| Measurement | Spanish American | Okinawan |
| Minimum | 0.30% | 0.58% |
| Maximum | 8.2% | 23.7% |
| Range | 7.9% | 23.1% |
| Mean | 2.7% | 8.3% |
| Median | 2.3% | 7.0% |
| Interquartile 25% (IQ1) | 0.95% | 5.0% |
| Interquartile 75% (IQ3) | 3.9% | 11.0% |
| Interquartile Range (IQR) | 3.0% | 6.0% |
| Standard Deviation (Sample) | 1.9% | 5.1% |
| Standard Deviation (Population) | 1.9% | 5.0% |
Similar Demographics by Professional Degree
Demographics Similar to Spanish Americans by Professional Degree
In terms of professional degree, the demographic groups most similar to Spanish Americans are Immigrants from Trinidad and Tobago (3.9%, a difference of 0.070%), Immigrants from Barbados (3.9%, a difference of 0.22%), Nonimmigrants (3.9%, a difference of 0.23%), Immigrants from Philippines (3.9%, a difference of 0.28%), and Cree (3.9%, a difference of 0.53%).
| Demographics | Rating | Rank | Professional Degree |
| Immigrants | Burma/Myanmar | 5.4 /100 | #229 | Tragic 3.9% |
| Nicaraguans | 5.1 /100 | #230 | Tragic 3.9% |
| Ecuadorians | 4.6 /100 | #231 | Tragic 3.9% |
| Cree | 4.3 /100 | #232 | Tragic 3.9% |
| Immigrants | Philippines | 4.1 /100 | #233 | Tragic 3.9% |
| Immigrants | Nonimmigrants | 4.0 /100 | #234 | Tragic 3.9% |
| Immigrants | Barbados | 4.0 /100 | #235 | Tragic 3.9% |
| Spanish Americans | 3.8 /100 | #236 | Tragic 3.9% |
| Immigrants | Trinidad and Tobago | 3.8 /100 | #237 | Tragic 3.9% |
| Colville | 2.6 /100 | #238 | Tragic 3.8% |
| British West Indians | 2.4 /100 | #239 | Tragic 3.8% |
| Immigrants | Ecuador | 2.3 /100 | #240 | Tragic 3.8% |
| Alaskan Athabascans | 2.3 /100 | #241 | Tragic 3.8% |
| Native Hawaiians | 2.3 /100 | #242 | Tragic 3.8% |
| Guamanians/Chamorros | 2.2 /100 | #243 | Tragic 3.8% |
Demographics Similar to Okinawans by Professional Degree
In terms of professional degree, the demographic groups most similar to Okinawans are Immigrants from Iran (7.3%, a difference of 0.11%), Eastern European (7.1%, a difference of 3.2%), Immigrants from Switzerland (7.1%, a difference of 3.3%), Filipino (7.6%, a difference of 3.4%), and Immigrants from Taiwan (7.1%, a difference of 3.5%).
| Demographics | Rating | Rank | Professional Degree |
| Immigrants | Israel | 100.0 /100 | #1 | Exceptional 7.9% |
| Immigrants | Singapore | 100.0 /100 | #2 | Exceptional 7.7% |
| Iranians | 100.0 /100 | #3 | Exceptional 7.6% |
| Filipinos | 100.0 /100 | #4 | Exceptional 7.6% |
| Immigrants | Iran | 100.0 /100 | #5 | Exceptional 7.3% |
| Okinawans | 100.0 /100 | #6 | Exceptional 7.3% |
| Eastern Europeans | 100.0 /100 | #7 | Exceptional 7.1% |
| Immigrants | Switzerland | 100.0 /100 | #8 | Exceptional 7.1% |
| Immigrants | Taiwan | 100.0 /100 | #9 | Exceptional 7.1% |
| Immigrants | Belgium | 100.0 /100 | #10 | Exceptional 7.0% |
| Cypriots | 100.0 /100 | #11 | Exceptional 6.9% |
| Israelis | 100.0 /100 | #12 | Exceptional 6.9% |
| Immigrants | Australia | 100.0 /100 | #13 | Exceptional 6.9% |
| Immigrants | France | 100.0 /100 | #14 | Exceptional 6.8% |
| Immigrants | China | 100.0 /100 | #15 | Exceptional 6.7% |