Dutch West Indian vs Okinawan Median Male Earnings
COMPARE
Dutch West Indian
Okinawan
Median Male Earnings
Median Male Earnings Comparison
Dutch West Indians
Okinawans
$46,656
MEDIAN MALE EARNINGS
0.0/ 100
METRIC RATING
306th/ 347
METRIC RANK
$67,232
MEDIAN MALE EARNINGS
100.0/ 100
METRIC RATING
14th/ 347
METRIC RANK
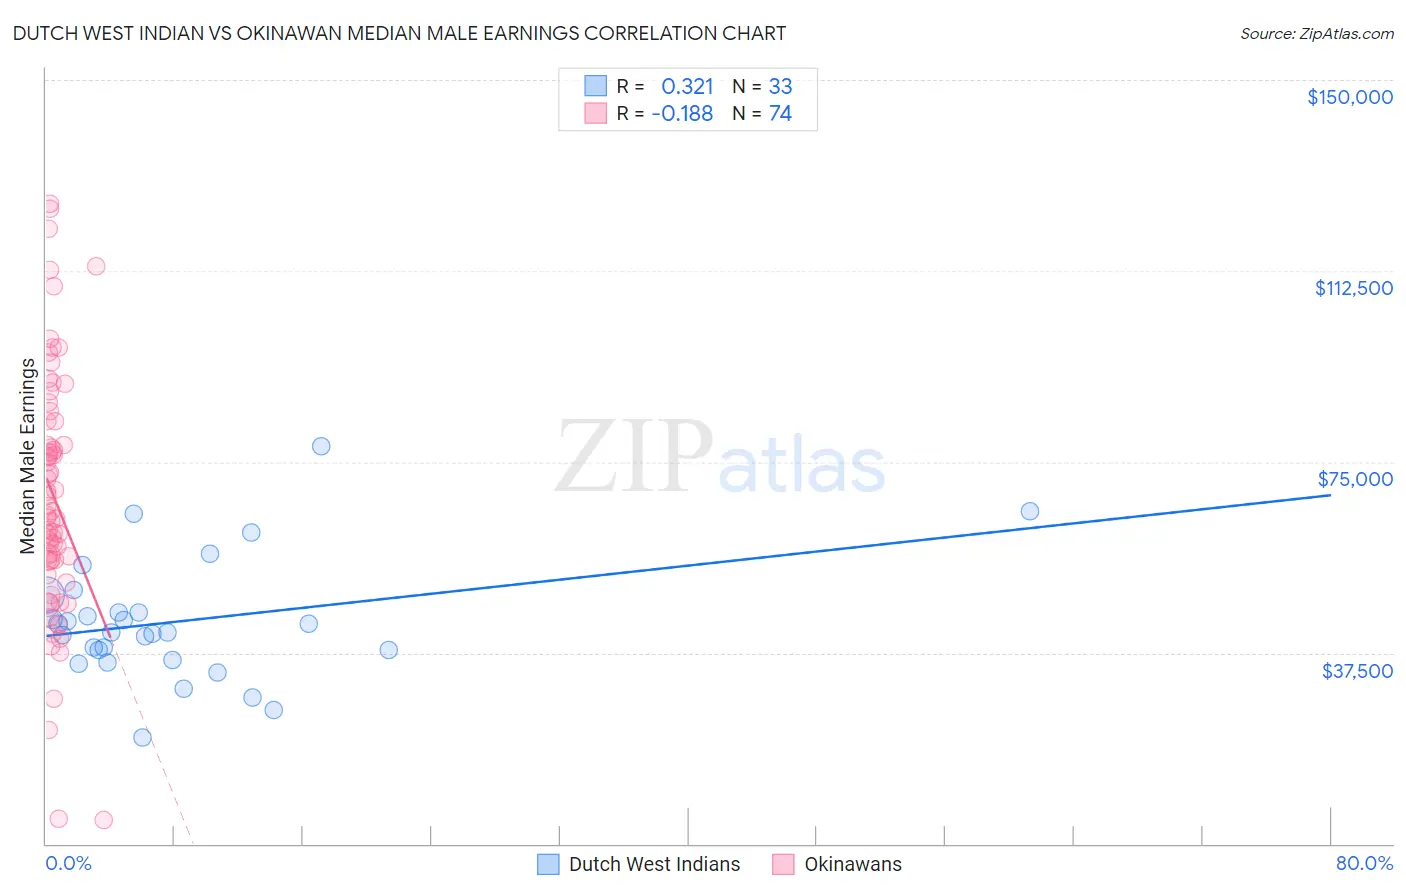
Dutch West Indian vs Okinawan Median Male Earnings Correlation Chart
The statistical analysis conducted on geographies consisting of 85,752,443 people shows a mild positive correlation between the proportion of Dutch West Indians and median male earnings in the United States with a correlation coefficient (R) of 0.321 and weighted average of $46,656. Similarly, the statistical analysis conducted on geographies consisting of 73,732,782 people shows a poor negative correlation between the proportion of Okinawans and median male earnings in the United States with a correlation coefficient (R) of -0.188 and weighted average of $67,232, a difference of 44.1%.
Median Male Earnings Correlation Summary
| Measurement | Dutch West Indian | Okinawan |
| Minimum | $20,833 | $4,698 |
| Maximum | $78,036 | $125,733 |
| Range | $57,203 | $121,035 |
| Mean | $43,636 | $68,280 |
| Median | $41,596 | $64,869 |
| Interquartile 25% (IQ1) | $37,034 | $55,642 |
| Interquartile 75% (IQ3) | $47,172 | $83,017 |
| Interquartile Range (IQR) | $10,138 | $27,375 |
| Standard Deviation (Sample) | $11,759 | $24,436 |
| Standard Deviation (Population) | $11,579 | $24,270 |
Similar Demographics by Median Male Earnings
Demographics Similar to Dutch West Indians by Median Male Earnings
In terms of median male earnings, the demographic groups most similar to Dutch West Indians are Immigrants from Dominican Republic ($46,655, a difference of 0.0%), Ottawa ($46,611, a difference of 0.10%), Creek ($46,594, a difference of 0.13%), Cuban ($46,580, a difference of 0.16%), and Guatemalan ($46,736, a difference of 0.17%).
| Demographics | Rating | Rank | Median Male Earnings |
| Immigrants | Zaire | 0.1 /100 | #299 | Tragic $47,070 |
| U.S. Virgin Islanders | 0.1 /100 | #300 | Tragic $47,066 |
| Immigrants | Latin America | 0.1 /100 | #301 | Tragic $46,941 |
| Seminole | 0.1 /100 | #302 | Tragic $46,783 |
| Yaqui | 0.1 /100 | #303 | Tragic $46,777 |
| Bangladeshis | 0.1 /100 | #304 | Tragic $46,744 |
| Guatemalans | 0.0 /100 | #305 | Tragic $46,736 |
| Dutch West Indians | 0.0 /100 | #306 | Tragic $46,656 |
| Immigrants | Dominican Republic | 0.0 /100 | #307 | Tragic $46,655 |
| Ottawa | 0.0 /100 | #308 | Tragic $46,611 |
| Creek | 0.0 /100 | #309 | Tragic $46,594 |
| Cubans | 0.0 /100 | #310 | Tragic $46,580 |
| Apache | 0.0 /100 | #311 | Tragic $46,429 |
| Hispanics or Latinos | 0.0 /100 | #312 | Tragic $46,419 |
| Hondurans | 0.0 /100 | #313 | Tragic $46,374 |
Demographics Similar to Okinawans by Median Male Earnings
In terms of median male earnings, the demographic groups most similar to Okinawans are Immigrants from China ($67,353, a difference of 0.18%), Immigrants from Eastern Asia ($66,903, a difference of 0.49%), Immigrants from Australia ($67,634, a difference of 0.60%), Immigrants from Ireland ($67,698, a difference of 0.69%), and Eastern European ($66,472, a difference of 1.1%).
| Demographics | Rating | Rank | Median Male Earnings |
| Immigrants | Hong Kong | 100.0 /100 | #7 | Exceptional $70,146 |
| Immigrants | Iran | 100.0 /100 | #8 | Exceptional $69,284 |
| Immigrants | South Central Asia | 100.0 /100 | #9 | Exceptional $68,960 |
| Immigrants | Israel | 100.0 /100 | #10 | Exceptional $68,716 |
| Immigrants | Ireland | 100.0 /100 | #11 | Exceptional $67,698 |
| Immigrants | Australia | 100.0 /100 | #12 | Exceptional $67,634 |
| Immigrants | China | 100.0 /100 | #13 | Exceptional $67,353 |
| Okinawans | 100.0 /100 | #14 | Exceptional $67,232 |
| Immigrants | Eastern Asia | 100.0 /100 | #15 | Exceptional $66,903 |
| Eastern Europeans | 100.0 /100 | #16 | Exceptional $66,472 |
| Immigrants | Belgium | 100.0 /100 | #17 | Exceptional $66,125 |
| Indians (Asian) | 100.0 /100 | #18 | Exceptional $66,078 |
| Cypriots | 100.0 /100 | #19 | Exceptional $65,549 |
| Immigrants | Japan | 100.0 /100 | #20 | Exceptional $65,518 |
| Immigrants | Sweden | 100.0 /100 | #21 | Exceptional $65,406 |