Spanish American Indian vs Immigrants from Greece Median Earnings
COMPARE
Spanish American Indian
Immigrants from Greece
Median Earnings
Median Earnings Comparison
Spanish American Indians
Immigrants from Greece
$38,907
MEDIAN EARNINGS
0.0/ 100
METRIC RATING
334th/ 347
METRIC RANK
$53,282
MEDIAN EARNINGS
100.0/ 100
METRIC RATING
33rd/ 347
METRIC RANK
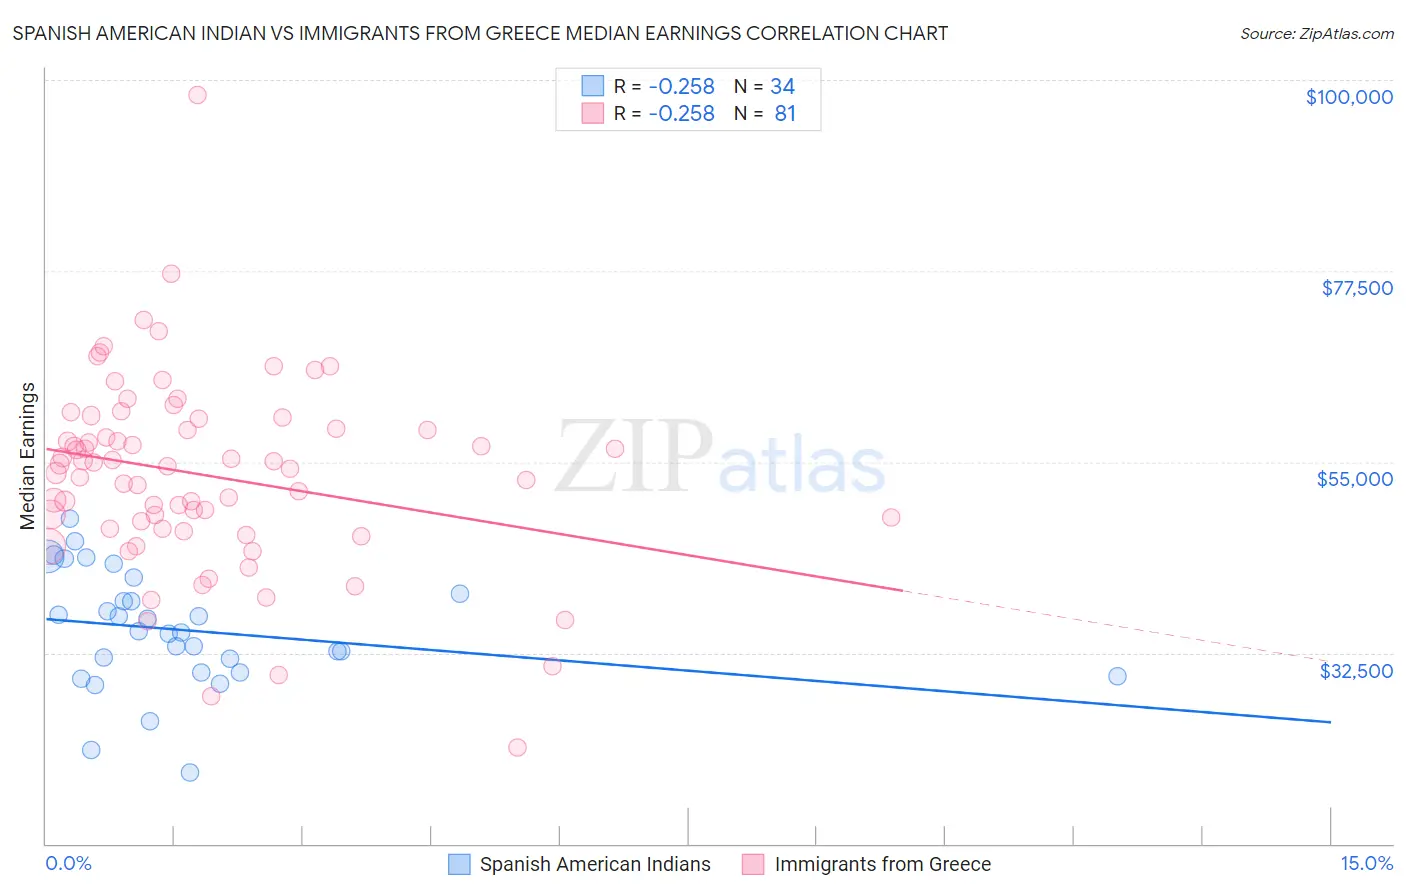
Spanish American Indian vs Immigrants from Greece Median Earnings Correlation Chart
The statistical analysis conducted on geographies consisting of 73,148,786 people shows a weak negative correlation between the proportion of Spanish American Indians and median earnings in the United States with a correlation coefficient (R) of -0.258 and weighted average of $38,907. Similarly, the statistical analysis conducted on geographies consisting of 216,859,908 people shows a weak negative correlation between the proportion of Immigrants from Greece and median earnings in the United States with a correlation coefficient (R) of -0.258 and weighted average of $53,282, a difference of 36.9%.
Median Earnings Correlation Summary
| Measurement | Spanish American Indian | Immigrants from Greece |
| Minimum | $18,469 | $21,296 |
| Maximum | $48,281 | $98,167 |
| Range | $29,812 | $76,871 |
| Mean | $35,173 | $53,424 |
| Median | $34,974 | $54,495 |
| Interquartile 25% (IQ1) | $30,208 | $47,153 |
| Interquartile 75% (IQ3) | $39,452 | $59,515 |
| Interquartile Range (IQR) | $9,244 | $12,362 |
| Standard Deviation (Sample) | $6,885 | $11,394 |
| Standard Deviation (Population) | $6,783 | $11,323 |
Similar Demographics by Median Earnings
Demographics Similar to Spanish American Indians by Median Earnings
In terms of median earnings, the demographic groups most similar to Spanish American Indians are Native/Alaskan ($38,896, a difference of 0.030%), Houma ($38,949, a difference of 0.11%), Yakama ($39,107, a difference of 0.52%), Crow ($38,707, a difference of 0.52%), and Immigrants from Mexico ($39,114, a difference of 0.53%).
| Demographics | Rating | Rank | Median Earnings |
| Yuman | 0.0 /100 | #327 | Tragic $39,523 |
| Sioux | 0.0 /100 | #328 | Tragic $39,448 |
| Kiowa | 0.0 /100 | #329 | Tragic $39,232 |
| Immigrants | Congo | 0.0 /100 | #330 | Tragic $39,169 |
| Immigrants | Mexico | 0.0 /100 | #331 | Tragic $39,114 |
| Yakama | 0.0 /100 | #332 | Tragic $39,107 |
| Houma | 0.0 /100 | #333 | Tragic $38,949 |
| Spanish American Indians | 0.0 /100 | #334 | Tragic $38,907 |
| Natives/Alaskans | 0.0 /100 | #335 | Tragic $38,896 |
| Crow | 0.0 /100 | #336 | Tragic $38,707 |
| Immigrants | Cuba | 0.0 /100 | #337 | Tragic $38,426 |
| Pima | 0.0 /100 | #338 | Tragic $38,285 |
| Menominee | 0.0 /100 | #339 | Tragic $37,884 |
| Navajo | 0.0 /100 | #340 | Tragic $36,999 |
| Lumbee | 0.0 /100 | #341 | Tragic $36,876 |
Demographics Similar to Immigrants from Greece by Median Earnings
In terms of median earnings, the demographic groups most similar to Immigrants from Greece are Immigrants from Sri Lanka ($53,268, a difference of 0.030%), Immigrants from Asia ($53,310, a difference of 0.050%), Russian ($53,334, a difference of 0.10%), Immigrants from Switzerland ($53,211, a difference of 0.13%), and Immigrants from Denmark ($53,186, a difference of 0.18%).
| Demographics | Rating | Rank | Median Earnings |
| Immigrants | Northern Europe | 100.0 /100 | #26 | Exceptional $53,872 |
| Asians | 100.0 /100 | #27 | Exceptional $53,690 |
| Immigrants | France | 100.0 /100 | #28 | Exceptional $53,490 |
| Immigrants | Russia | 100.0 /100 | #29 | Exceptional $53,457 |
| Cambodians | 100.0 /100 | #30 | Exceptional $53,386 |
| Russians | 100.0 /100 | #31 | Exceptional $53,334 |
| Immigrants | Asia | 100.0 /100 | #32 | Exceptional $53,310 |
| Immigrants | Greece | 100.0 /100 | #33 | Exceptional $53,282 |
| Immigrants | Sri Lanka | 100.0 /100 | #34 | Exceptional $53,268 |
| Immigrants | Switzerland | 100.0 /100 | #35 | Exceptional $53,211 |
| Immigrants | Denmark | 100.0 /100 | #36 | Exceptional $53,186 |
| Immigrants | Belarus | 100.0 /100 | #37 | Exceptional $53,043 |
| Latvians | 100.0 /100 | #38 | Exceptional $53,001 |
| Immigrants | Turkey | 100.0 /100 | #39 | Exceptional $52,960 |
| Israelis | 100.0 /100 | #40 | Exceptional $52,937 |