Spanish American Indian vs Immigrants from Hong Kong Disability Age 65 to 74
COMPARE
Spanish American Indian
Immigrants from Hong Kong
Disability Age 65 to 74
Disability Age 65 to 74 Comparison
Spanish American Indians
Immigrants from Hong Kong
26.4%
DISABILITY AGE 65 TO 74
0.0/ 100
METRIC RATING
291st/ 347
METRIC RANK
19.9%
DISABILITY AGE 65 TO 74
100.0/ 100
METRIC RATING
4th/ 347
METRIC RANK
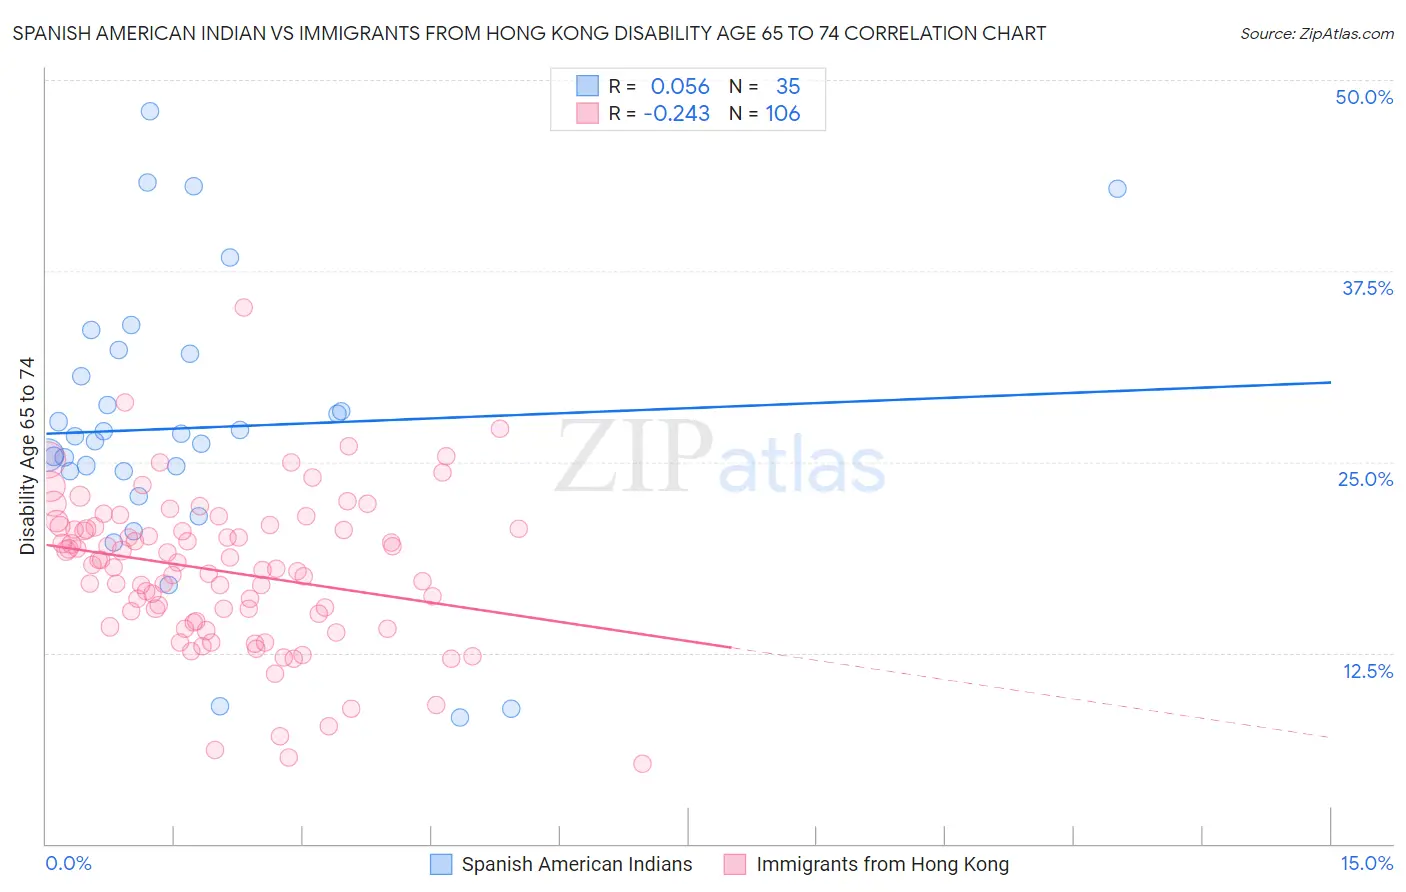
Spanish American Indian vs Immigrants from Hong Kong Disability Age 65 to 74 Correlation Chart
The statistical analysis conducted on geographies consisting of 73,139,932 people shows a slight positive correlation between the proportion of Spanish American Indians and percentage of population with a disability between the ages 65 and 75 in the United States with a correlation coefficient (R) of 0.056 and weighted average of 26.4%. Similarly, the statistical analysis conducted on geographies consisting of 253,698,162 people shows a weak negative correlation between the proportion of Immigrants from Hong Kong and percentage of population with a disability between the ages 65 and 75 in the United States with a correlation coefficient (R) of -0.243 and weighted average of 19.9%, a difference of 32.8%.
Disability Age 65 to 74 Correlation Summary
| Measurement | Spanish American Indian | Immigrants from Hong Kong |
| Minimum | 8.2% | 5.3% |
| Maximum | 47.9% | 35.1% |
| Range | 39.7% | 29.8% |
| Mean | 27.2% | 17.8% |
| Median | 26.7% | 18.2% |
| Interquartile 25% (IQ1) | 24.4% | 14.6% |
| Interquartile 75% (IQ3) | 32.1% | 20.6% |
| Interquartile Range (IQR) | 7.7% | 6.0% |
| Standard Deviation (Sample) | 9.1% | 5.0% |
| Standard Deviation (Population) | 8.9% | 4.9% |
Similar Demographics by Disability Age 65 to 74
Demographics Similar to Spanish American Indians by Disability Age 65 to 74
In terms of disability age 65 to 74, the demographic groups most similar to Spanish American Indians are Immigrants from Cabo Verde (26.3%, a difference of 0.20%), African (26.2%, a difference of 0.50%), Mexican American Indian (26.2%, a difference of 0.82%), Blackfeet (26.6%, a difference of 0.88%), and Immigrants from Laos (26.1%, a difference of 0.91%).
| Demographics | Rating | Rank | Disability Age 65 to 74 |
| Immigrants | Azores | 0.0 /100 | #284 | Tragic 26.0% |
| Immigrants | Congo | 0.0 /100 | #285 | Tragic 26.0% |
| Immigrants | Micronesia | 0.0 /100 | #286 | Tragic 26.1% |
| Immigrants | Laos | 0.0 /100 | #287 | Tragic 26.1% |
| Mexican American Indians | 0.0 /100 | #288 | Tragic 26.2% |
| Africans | 0.0 /100 | #289 | Tragic 26.2% |
| Immigrants | Cabo Verde | 0.0 /100 | #290 | Tragic 26.3% |
| Spanish American Indians | 0.0 /100 | #291 | Tragic 26.4% |
| Blackfeet | 0.0 /100 | #292 | Tragic 26.6% |
| Immigrants | Central America | 0.0 /100 | #293 | Tragic 26.6% |
| Dominicans | 0.0 /100 | #294 | Tragic 26.7% |
| Hispanics or Latinos | 0.0 /100 | #295 | Tragic 26.7% |
| Bangladeshis | 0.0 /100 | #296 | Tragic 26.8% |
| Fijians | 0.0 /100 | #297 | Tragic 27.0% |
| Immigrants | Yemen | 0.0 /100 | #298 | Tragic 27.0% |
Demographics Similar to Immigrants from Hong Kong by Disability Age 65 to 74
In terms of disability age 65 to 74, the demographic groups most similar to Immigrants from Hong Kong are Immigrants from Israel (19.9%, a difference of 0.30%), Iranian (19.9%, a difference of 0.41%), Immigrants from India (19.7%, a difference of 0.84%), Cypriot (20.1%, a difference of 1.1%), and Thai (20.1%, a difference of 1.1%).
| Demographics | Rating | Rank | Disability Age 65 to 74 |
| Immigrants | Taiwan | 100.0 /100 | #1 | Exceptional 18.8% |
| Filipinos | 100.0 /100 | #2 | Exceptional 19.0% |
| Immigrants | India | 100.0 /100 | #3 | Exceptional 19.7% |
| Immigrants | Hong Kong | 100.0 /100 | #4 | Exceptional 19.9% |
| Immigrants | Israel | 100.0 /100 | #5 | Exceptional 19.9% |
| Iranians | 100.0 /100 | #6 | Exceptional 19.9% |
| Cypriots | 100.0 /100 | #7 | Exceptional 20.1% |
| Thais | 100.0 /100 | #8 | Exceptional 20.1% |
| Immigrants | China | 100.0 /100 | #9 | Exceptional 20.3% |
| Immigrants | Eastern Asia | 100.0 /100 | #10 | Exceptional 20.3% |
| Immigrants | Ireland | 100.0 /100 | #11 | Exceptional 20.3% |
| Immigrants | Korea | 100.0 /100 | #12 | Exceptional 20.4% |
| Immigrants | Singapore | 100.0 /100 | #13 | Exceptional 20.4% |
| Indians (Asian) | 100.0 /100 | #14 | Exceptional 20.5% |
| Paraguayans | 100.0 /100 | #15 | Exceptional 20.5% |