Spaniard vs Immigrants from Kenya Householder Income Ages 45 - 64 years
COMPARE
Spaniard
Immigrants from Kenya
Householder Income Ages 45 - 64 years
Householder Income Ages 45 - 64 years Comparison
Spaniards
Immigrants from Kenya
$99,889
HOUSEHOLDER INCOME AGES 45 - 64 YEARS
44.6/ 100
METRIC RATING
183rd/ 347
METRIC RANK
$97,964
HOUSEHOLDER INCOME AGES 45 - 64 YEARS
23.5/ 100
METRIC RATING
200th/ 347
METRIC RANK
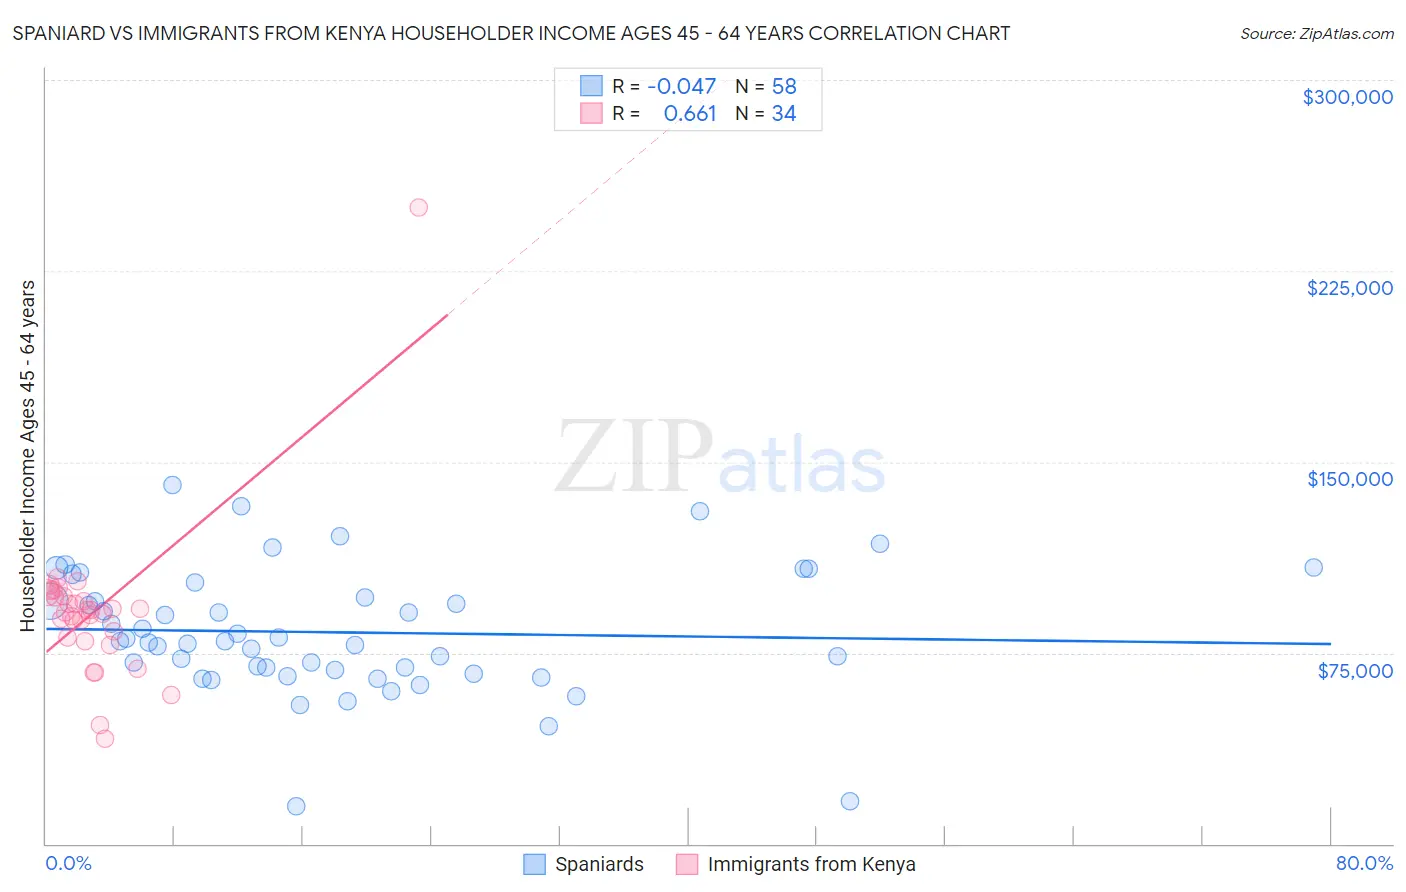
Spaniard vs Immigrants from Kenya Householder Income Ages 45 - 64 years Correlation Chart
The statistical analysis conducted on geographies consisting of 442,373,323 people shows no correlation between the proportion of Spaniards and household income with householder between the ages 45 and 64 in the United States with a correlation coefficient (R) of -0.047 and weighted average of $99,889. Similarly, the statistical analysis conducted on geographies consisting of 217,894,820 people shows a significant positive correlation between the proportion of Immigrants from Kenya and household income with householder between the ages 45 and 64 in the United States with a correlation coefficient (R) of 0.661 and weighted average of $97,964, a difference of 2.0%.
Householder Income Ages 45 - 64 years Correlation Summary
| Measurement | Spaniard | Immigrants from Kenya |
| Minimum | $14,806 | $41,343 |
| Maximum | $140,801 | $250,001 |
| Range | $125,995 | $208,658 |
| Mean | $83,048 | $91,195 |
| Median | $79,425 | $91,314 |
| Interquartile 25% (IQ1) | $68,311 | $80,833 |
| Interquartile 75% (IQ3) | $96,594 | $97,063 |
| Interquartile Range (IQR) | $28,282 | $16,231 |
| Standard Deviation (Sample) | $24,571 | $31,961 |
| Standard Deviation (Population) | $24,358 | $31,487 |
Demographics Similar to Spaniards and Immigrants from Kenya by Householder Income Ages 45 - 64 years
In terms of householder income ages 45 - 64 years, the demographic groups most similar to Spaniards are Finnish ($99,904, a difference of 0.010%), Immigrants ($99,943, a difference of 0.050%), French ($99,824, a difference of 0.070%), Colombian ($99,772, a difference of 0.12%), and Dutch ($99,650, a difference of 0.24%). Similarly, the demographic groups most similar to Immigrants from Kenya are White/Caucasian ($98,091, a difference of 0.13%), Immigrants from Iraq ($98,201, a difference of 0.24%), Puget Sound Salish ($98,340, a difference of 0.38%), Yugoslavian ($97,558, a difference of 0.42%), and Immigrants from Eastern Africa ($98,467, a difference of 0.51%).
| Demographics | Rating | Rank | Householder Income Ages 45 - 64 years |
| Immigrants | Immigrants | 45.3 /100 | #181 | Average $99,943 |
| Finns | 44.8 /100 | #182 | Average $99,904 |
| Spaniards | 44.6 /100 | #183 | Average $99,889 |
| French | 43.8 /100 | #184 | Average $99,824 |
| Colombians | 43.2 /100 | #185 | Average $99,772 |
| Dutch | 41.7 /100 | #186 | Average $99,650 |
| Iraqis | 38.5 /100 | #187 | Fair $99,387 |
| Immigrants | Portugal | 36.3 /100 | #188 | Fair $99,203 |
| Immigrants | South America | 35.4 /100 | #189 | Fair $99,126 |
| French Canadians | 35.1 /100 | #190 | Fair $99,093 |
| Kenyans | 33.7 /100 | #191 | Fair $98,970 |
| Celtics | 32.9 /100 | #192 | Fair $98,896 |
| Hawaiians | 31.6 /100 | #193 | Fair $98,778 |
| Uruguayans | 30.3 /100 | #194 | Fair $98,660 |
| Spanish | 29.2 /100 | #195 | Fair $98,554 |
| Immigrants | Eastern Africa | 28.3 /100 | #196 | Fair $98,467 |
| Puget Sound Salish | 27.0 /100 | #197 | Fair $98,340 |
| Immigrants | Iraq | 25.7 /100 | #198 | Fair $98,201 |
| Whites/Caucasians | 24.6 /100 | #199 | Fair $98,091 |
| Immigrants | Kenya | 23.5 /100 | #200 | Fair $97,964 |
| Yugoslavians | 20.0 /100 | #201 | Fair $97,558 |