Spaniard vs South African Householder Income Ages 45 - 64 years
COMPARE
Spaniard
South African
Householder Income Ages 45 - 64 years
Householder Income Ages 45 - 64 years Comparison
Spaniards
South Africans
$99,889
HOUSEHOLDER INCOME AGES 45 - 64 YEARS
44.6/ 100
METRIC RATING
183rd/ 347
METRIC RANK
$109,719
HOUSEHOLDER INCOME AGES 45 - 64 YEARS
99.1/ 100
METRIC RATING
75th/ 347
METRIC RANK
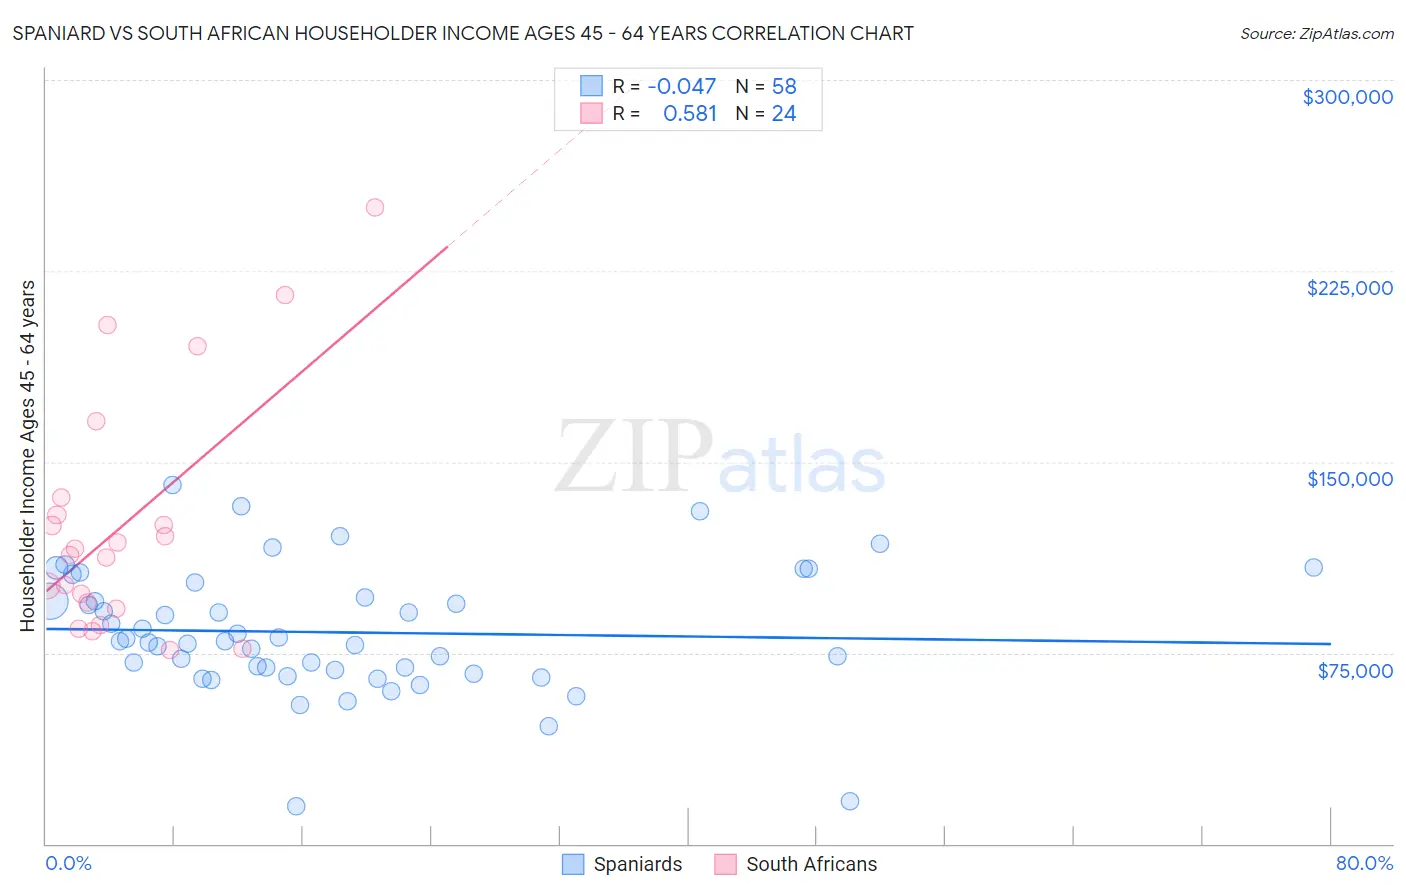
Spaniard vs South African Householder Income Ages 45 - 64 years Correlation Chart
The statistical analysis conducted on geographies consisting of 442,373,323 people shows no correlation between the proportion of Spaniards and household income with householder between the ages 45 and 64 in the United States with a correlation coefficient (R) of -0.047 and weighted average of $99,889. Similarly, the statistical analysis conducted on geographies consisting of 182,453,262 people shows a substantial positive correlation between the proportion of South Africans and household income with householder between the ages 45 and 64 in the United States with a correlation coefficient (R) of 0.581 and weighted average of $109,719, a difference of 9.8%.
Householder Income Ages 45 - 64 years Correlation Summary
| Measurement | Spaniard | South African |
| Minimum | $14,806 | $76,250 |
| Maximum | $140,801 | $250,001 |
| Range | $125,995 | $173,751 |
| Mean | $83,048 | $125,894 |
| Median | $79,425 | $114,605 |
| Interquartile 25% (IQ1) | $68,311 | $93,424 |
| Interquartile 75% (IQ3) | $96,594 | $132,734 |
| Interquartile Range (IQR) | $28,282 | $39,311 |
| Standard Deviation (Sample) | $24,571 | $46,946 |
| Standard Deviation (Population) | $24,358 | $45,958 |
Similar Demographics by Householder Income Ages 45 - 64 years
Demographics Similar to Spaniards by Householder Income Ages 45 - 64 years
In terms of householder income ages 45 - 64 years, the demographic groups most similar to Spaniards are Finnish ($99,904, a difference of 0.010%), Immigrants ($99,943, a difference of 0.050%), French ($99,824, a difference of 0.070%), Colombian ($99,772, a difference of 0.12%), and Aleut ($100,052, a difference of 0.16%).
| Demographics | Rating | Rank | Householder Income Ages 45 - 64 years |
| Immigrants | Costa Rica | 47.7 /100 | #176 | Average $100,141 |
| Moroccans | 47.7 /100 | #177 | Average $100,138 |
| Immigrants | Cameroon | 47.0 /100 | #178 | Average $100,084 |
| Belgians | 46.7 /100 | #179 | Average $100,060 |
| Aleuts | 46.6 /100 | #180 | Average $100,052 |
| Immigrants | Immigrants | 45.3 /100 | #181 | Average $99,943 |
| Finns | 44.8 /100 | #182 | Average $99,904 |
| Spaniards | 44.6 /100 | #183 | Average $99,889 |
| French | 43.8 /100 | #184 | Average $99,824 |
| Colombians | 43.2 /100 | #185 | Average $99,772 |
| Dutch | 41.7 /100 | #186 | Average $99,650 |
| Iraqis | 38.5 /100 | #187 | Fair $99,387 |
| Immigrants | Portugal | 36.3 /100 | #188 | Fair $99,203 |
| Immigrants | South America | 35.4 /100 | #189 | Fair $99,126 |
| French Canadians | 35.1 /100 | #190 | Fair $99,093 |
Demographics Similar to South Africans by Householder Income Ages 45 - 64 years
In terms of householder income ages 45 - 64 years, the demographic groups most similar to South Africans are Immigrants from Egypt ($109,941, a difference of 0.20%), Paraguayan ($109,447, a difference of 0.25%), Immigrants from England ($109,446, a difference of 0.25%), Immigrants from Canada ($109,402, a difference of 0.29%), and Immigrants from Bulgaria ($109,379, a difference of 0.31%).
| Demographics | Rating | Rank | Householder Income Ages 45 - 64 years |
| Immigrants | Romania | 99.4 /100 | #68 | Exceptional $110,633 |
| Immigrants | Italy | 99.4 /100 | #69 | Exceptional $110,434 |
| Koreans | 99.3 /100 | #70 | Exceptional $110,334 |
| Italians | 99.3 /100 | #71 | Exceptional $110,224 |
| Assyrians/Chaldeans/Syriacs | 99.3 /100 | #72 | Exceptional $110,201 |
| Argentineans | 99.3 /100 | #73 | Exceptional $110,103 |
| Immigrants | Egypt | 99.2 /100 | #74 | Exceptional $109,941 |
| South Africans | 99.1 /100 | #75 | Exceptional $109,719 |
| Paraguayans | 99.0 /100 | #76 | Exceptional $109,447 |
| Immigrants | England | 99.0 /100 | #77 | Exceptional $109,446 |
| Immigrants | Canada | 99.0 /100 | #78 | Exceptional $109,402 |
| Immigrants | Bulgaria | 98.9 /100 | #79 | Exceptional $109,379 |
| Jordanians | 98.9 /100 | #80 | Exceptional $109,376 |
| Immigrants | Eastern Europe | 98.9 /100 | #81 | Exceptional $109,335 |
| Immigrants | North America | 98.8 /100 | #82 | Exceptional $109,198 |