Scottish vs Immigrants from Bulgaria Per Capita Income
COMPARE
Scottish
Immigrants from Bulgaria
Per Capita Income
Per Capita Income Comparison
Scottish
Immigrants from Bulgaria
$44,440
PER CAPITA INCOME
70.6/ 100
METRIC RATING
153rd/ 347
METRIC RANK
$49,482
PER CAPITA INCOME
99.9/ 100
METRIC RATING
66th/ 347
METRIC RANK
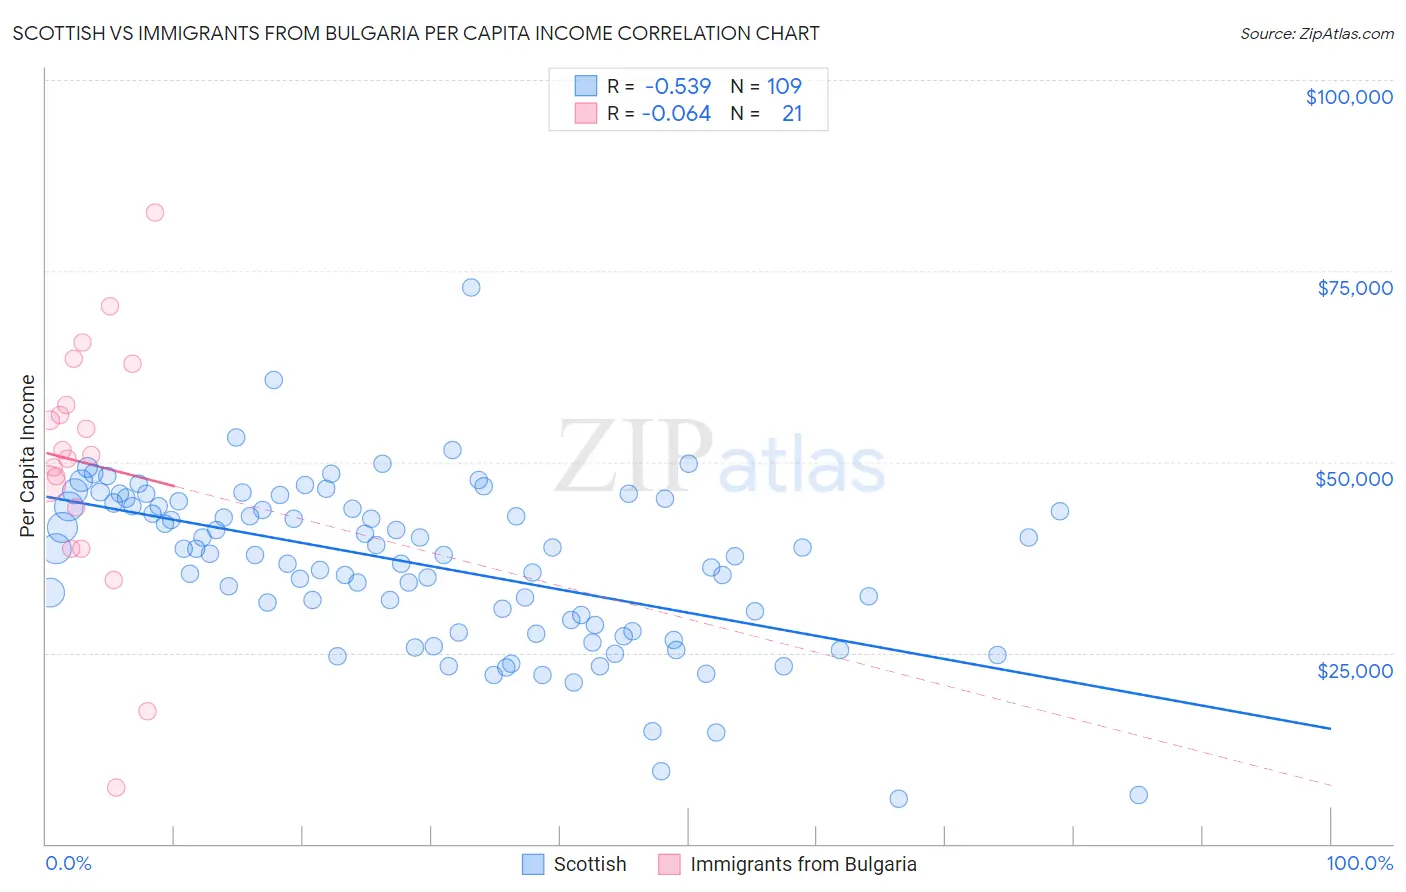
Scottish vs Immigrants from Bulgaria Per Capita Income Correlation Chart
The statistical analysis conducted on geographies consisting of 567,196,152 people shows a substantial negative correlation between the proportion of Scottish and per capita income in the United States with a correlation coefficient (R) of -0.539 and weighted average of $44,440. Similarly, the statistical analysis conducted on geographies consisting of 172,552,113 people shows a slight negative correlation between the proportion of Immigrants from Bulgaria and per capita income in the United States with a correlation coefficient (R) of -0.064 and weighted average of $49,482, a difference of 11.4%.
Per Capita Income Correlation Summary
| Measurement | Scottish | Immigrants from Bulgaria |
| Minimum | $5,913 | $7,295 |
| Maximum | $72,790 | $82,704 |
| Range | $66,877 | $75,409 |
| Mean | $36,544 | $49,825 |
| Median | $37,961 | $50,915 |
| Interquartile 25% (IQ1) | $28,258 | $41,288 |
| Interquartile 75% (IQ3) | $44,399 | $60,205 |
| Interquartile Range (IQR) | $16,142 | $18,917 |
| Standard Deviation (Sample) | $10,868 | $16,836 |
| Standard Deviation (Population) | $10,818 | $16,430 |
Similar Demographics by Per Capita Income
Demographics Similar to Scottish by Per Capita Income
In terms of per capita income, the demographic groups most similar to Scottish are Norwegian ($44,480, a difference of 0.090%), Peruvian ($44,479, a difference of 0.090%), Immigrants from Eritrea ($44,509, a difference of 0.16%), Portuguese ($44,362, a difference of 0.18%), and Korean ($44,522, a difference of 0.19%).
| Demographics | Rating | Rank | Per Capita Income |
| Irish | 75.8 /100 | #146 | Good $44,679 |
| Czechs | 74.1 /100 | #147 | Good $44,595 |
| Immigrants | Armenia | 73.1 /100 | #148 | Good $44,552 |
| Koreans | 72.5 /100 | #149 | Good $44,522 |
| Immigrants | Eritrea | 72.1 /100 | #150 | Good $44,509 |
| Norwegians | 71.5 /100 | #151 | Good $44,480 |
| Peruvians | 71.5 /100 | #152 | Good $44,479 |
| Scottish | 70.6 /100 | #153 | Good $44,440 |
| Portuguese | 68.7 /100 | #154 | Good $44,362 |
| Uruguayans | 67.6 /100 | #155 | Good $44,318 |
| Slovaks | 65.4 /100 | #156 | Good $44,229 |
| South American Indians | 64.8 /100 | #157 | Good $44,206 |
| Immigrants | Nepal | 64.3 /100 | #158 | Good $44,187 |
| South Americans | 62.4 /100 | #159 | Good $44,114 |
| Danes | 61.9 /100 | #160 | Good $44,095 |
Demographics Similar to Immigrants from Bulgaria by Per Capita Income
In terms of per capita income, the demographic groups most similar to Immigrants from Bulgaria are Immigrants from Romania ($49,463, a difference of 0.040%), Lithuanian ($49,448, a difference of 0.070%), Bolivian ($49,526, a difference of 0.090%), Immigrants from Canada ($49,412, a difference of 0.14%), and Immigrants from Argentina ($49,627, a difference of 0.29%).
| Demographics | Rating | Rank | Per Capita Income |
| Bhutanese | 99.9 /100 | #59 | Exceptional $49,894 |
| Immigrants | Scotland | 99.9 /100 | #60 | Exceptional $49,893 |
| Argentineans | 99.9 /100 | #61 | Exceptional $49,862 |
| Immigrants | Asia | 99.9 /100 | #62 | Exceptional $49,741 |
| Maltese | 99.9 /100 | #63 | Exceptional $49,640 |
| Immigrants | Argentina | 99.9 /100 | #64 | Exceptional $49,627 |
| Bolivians | 99.9 /100 | #65 | Exceptional $49,526 |
| Immigrants | Bulgaria | 99.9 /100 | #66 | Exceptional $49,482 |
| Immigrants | Romania | 99.9 /100 | #67 | Exceptional $49,463 |
| Lithuanians | 99.8 /100 | #68 | Exceptional $49,448 |
| Immigrants | Canada | 99.8 /100 | #69 | Exceptional $49,412 |
| Immigrants | Eastern Europe | 99.8 /100 | #70 | Exceptional $49,316 |
| Greeks | 99.8 /100 | #71 | Exceptional $49,309 |
| Immigrants | Hungary | 99.8 /100 | #72 | Exceptional $49,303 |
| Immigrants | North America | 99.8 /100 | #73 | Exceptional $49,302 |