Shoshone vs Immigrants from Bulgaria Per Capita Income

COMPARE

Shoshone
Race
Ancestry
AfghanAfricanAlaska NativeAlaskan AthabascanAlbanianAleutAlsatianAmericanApacheArabArapahoArgentineanArmenianAssyrian/Chaldean/SyriacAustralianAustrianBahamianBangladeshiBarbadianBasqueBelgianBelizeanBermudanBhutaneseBlackfeetBolivianBrazilianBritishBritish West IndianBulgarianBurmeseCajunCambodianCanadianCape VerdeanCarpatho RusynCelticCentral AmericanCentral American IndianCherokeeCheyenneChickasawChileanChineseChippewaChoctawColombianColvilleComancheCosta RicanCreeCreekCroatianCrowCubanCypriotCzechCzechoslovakianDanishDelawareDominicanDutchDutch West IndianEastern EuropeanEcuadorianEgyptianEnglishEstonianEthiopianEuropeanFijianFilipinoFinnishFrenchFrench American IndianFrench CanadianGermanGerman RussianGhanaianGreekGuamanian/ChamorroGuatemalanGuyaneseHaitianHmongHonduranHopiHoumaHungarianIcelanderIndian (Asian)IndonesianInupiatIranianIraqiIrishIroquoisIsraeliItalianJamaicanJapaneseJordanianKenyanKiowaKoreanLaotianLatvianLebaneseLiberianLithuanianLumbeeLuxembourgerMacedonianMalaysianMalteseMarshalleseMenomineeMexicanMexican American IndianMongolianMoroccanNative HawaiianNavajoNepaleseNew ZealanderNicaraguanNigerianNorthern EuropeanNorwegianOkinawanOsageOttawaPaiutePakistaniPalestinianPanamanianParaguayanPennsylvania GermanPeruvianPimaPolishPortuguesePotawatomiPuebloPuerto RicanPuget Sound SalishRomanianRussianSalvadoranSamoanScandinavianScotch-IrishScottishSeminoleSenegaleseSerbianShoshoneSierra LeoneanSiouxSlavicSlovakSloveneSomaliSouth AfricanSouth AmericanSouth American IndianSoviet UnionSpaniardSpanishSpanish AmericanSpanish American IndianSri LankanSubsaharan AfricanSudaneseSwedishSwissSyrianTaiwaneseThaiTlingit-HaidaTohono O'OdhamTonganTrinidadian and TobagonianTsimshianTurkishU.S. Virgin IslanderUgandanUkrainianUruguayanUteVenezuelanVietnameseWelshWest IndianYakamaYaquiYugoslavianYumanYup'ikZimbabwean
Immigration
NonimmigrantsImmigrantsAfghanistanAfricaAlbaniaArgentinaArmeniaAsiaAustraliaAustriaBahamasBangladeshBarbadosBelarusBelgiumBelizeBoliviaBosnia and HerzegovinaBrazilBurma/MyanmarCabo VerdeCambodiaCameroonCanadaCaribbeanCentral AmericaChileChinaColombiaCongoCosta RicaCroatiaCubaCzechoslovakiaDenmarkDominicaDominican RepublicEastern AfricaEastern AsiaEastern EuropeEcuadorEgyptEl SalvadorEnglandEritreaEthiopiaEuropeFijiFranceGermanyGhanaGreeceGrenadaGuatemalaGuyanaHaitiHondurasHong KongHungaryIndiaIndonesiaIranIraqIrelandIsraelItalyJamaicaJapanJordanKazakhstanKenyaKoreaKuwaitLaosLatin AmericaLatviaLebanonLiberiaLithuaniaMalaysiaMexicoMicronesiaMiddle AfricaMoldovaMoroccoNepalNetherlandsNicaraguaNigeriaNorth AmericaNorth MacedoniaNorthern AfricaNorthern EuropeNorwayOceaniaPakistanPanamaPeruPhilippinesPolandPortugalRomaniaRussiaSaudi ArabiaScotlandSenegalSerbiaSierra LeoneSingaporeSomaliaSouth AfricaSouth AmericaSouth Central AsiaSouth Eastern AsiaSouthern EuropeSpainSri LankaSt. Vincent and the GrenadinesSudanSwedenSwitzerlandSyriaTaiwanThailandTrinidad and TobagoTurkeyUgandaUkraineUruguayUzbekistanVenezuelaVietnamWest IndiesWestern AfricaWestern AsiaWestern EuropeYemenZaireZimbabweAzores
Immigrants from Bulgaria
Race
Ancestry
AfghanAfricanAlaska NativeAlaskan AthabascanAlbanianAleutAlsatianAmericanApacheArabArapahoArgentineanArmenianAssyrian/Chaldean/SyriacAustralianAustrianBahamianBangladeshiBarbadianBasqueBelgianBelizeanBermudanBhutaneseBlackfeetBolivianBrazilianBritishBritish West IndianBulgarianBurmeseCajunCambodianCanadianCape VerdeanCarpatho RusynCelticCentral AmericanCentral American IndianCherokeeCheyenneChickasawChileanChineseChippewaChoctawColombianColvilleComancheCosta RicanCreeCreekCroatianCrowCubanCypriotCzechCzechoslovakianDanishDelawareDominicanDutchDutch West IndianEastern EuropeanEcuadorianEgyptianEnglishEstonianEthiopianEuropeanFijianFilipinoFinnishFrenchFrench American IndianFrench CanadianGermanGerman RussianGhanaianGreekGuamanian/ChamorroGuatemalanGuyaneseHaitianHmongHonduranHopiHoumaHungarianIcelanderIndian (Asian)IndonesianInupiatIranianIraqiIrishIroquoisIsraeliItalianJamaicanJapaneseJordanianKenyanKiowaKoreanLaotianLatvianLebaneseLiberianLithuanianLumbeeLuxembourgerMacedonianMalaysianMalteseMarshalleseMenomineeMexicanMexican American IndianMongolianMoroccanNative HawaiianNavajoNepaleseNew ZealanderNicaraguanNigerianNorthern EuropeanNorwegianOkinawanOsageOttawaPaiutePakistaniPalestinianPanamanianParaguayanPennsylvania GermanPeruvianPimaPolishPortuguesePotawatomiPuebloPuerto RicanPuget Sound SalishRomanianRussianSalvadoranSamoanScandinavianScotch-IrishScottishSeminoleSenegaleseSerbianSierra LeoneanSiouxSlavicSlovakSloveneSomaliSouth AfricanSouth AmericanSouth American IndianSoviet UnionSpaniardSpanishSpanish AmericanSpanish American IndianSri LankanSubsaharan AfricanSudaneseSwedishSwissSyrianTaiwaneseThaiTlingit-HaidaTohono O'OdhamTonganTrinidadian and TobagonianTsimshianTurkishU.S. Virgin IslanderUgandanUkrainianUruguayanUteVenezuelanVietnameseWelshWest IndianYakamaYaquiYugoslavianYumanYup'ikZimbabwean
Immigration
NonimmigrantsImmigrantsAfghanistanAfricaAlbaniaArgentinaArmeniaAsiaAustraliaAustriaBahamasBangladeshBarbadosBelarusBelgiumBelizeBoliviaBosnia and HerzegovinaBrazilBulgariaBurma/MyanmarCabo VerdeCambodiaCameroonCanadaCaribbeanCentral AmericaChileChinaColombiaCongoCosta RicaCroatiaCubaCzechoslovakiaDenmarkDominicaDominican RepublicEastern AfricaEastern AsiaEastern EuropeEcuadorEgyptEl SalvadorEnglandEritreaEthiopiaEuropeFijiFranceGermanyGhanaGreeceGrenadaGuatemalaGuyanaHaitiHondurasHong KongHungaryIndiaIndonesiaIranIraqIrelandIsraelItalyJamaicaJapanJordanKazakhstanKenyaKoreaKuwaitLaosLatin AmericaLatviaLebanonLiberiaLithuaniaMalaysiaMexicoMicronesiaMiddle AfricaMoldovaMoroccoNepalNetherlandsNicaraguaNigeriaNorth AmericaNorth MacedoniaNorthern AfricaNorthern EuropeNorwayOceaniaPakistanPanamaPeruPhilippinesPolandPortugalRomaniaRussiaSaudi ArabiaScotlandSenegalSerbiaSierra LeoneSingaporeSomaliaSouth AfricaSouth AmericaSouth Central AsiaSouth Eastern AsiaSouthern EuropeSpainSri LankaSt. Vincent and the GrenadinesSudanSwedenSwitzerlandSyriaTaiwanThailandTrinidad and TobagoTurkeyUgandaUkraineUruguayUzbekistanVenezuelaVietnamWest IndiesWestern AfricaWestern AsiaWestern EuropeYemenZaireZimbabweAzores
Per Capita Income
Income
Poverty
Unemployment
Labor Participation
Family Structure
Vehicle Availability
Education Level
Disability

Per Capita Income Comparison

Shoshone

Immigrants from Bulgaria

Tragic
Exceptional
$37,072
PER CAPITA INCOME
0.1/ 100
METRIC RATING
302nd/ 347
METRIC RANK
$49,482
PER CAPITA INCOME
99.9/ 100
METRIC RATING
66th/ 347
METRIC RANK

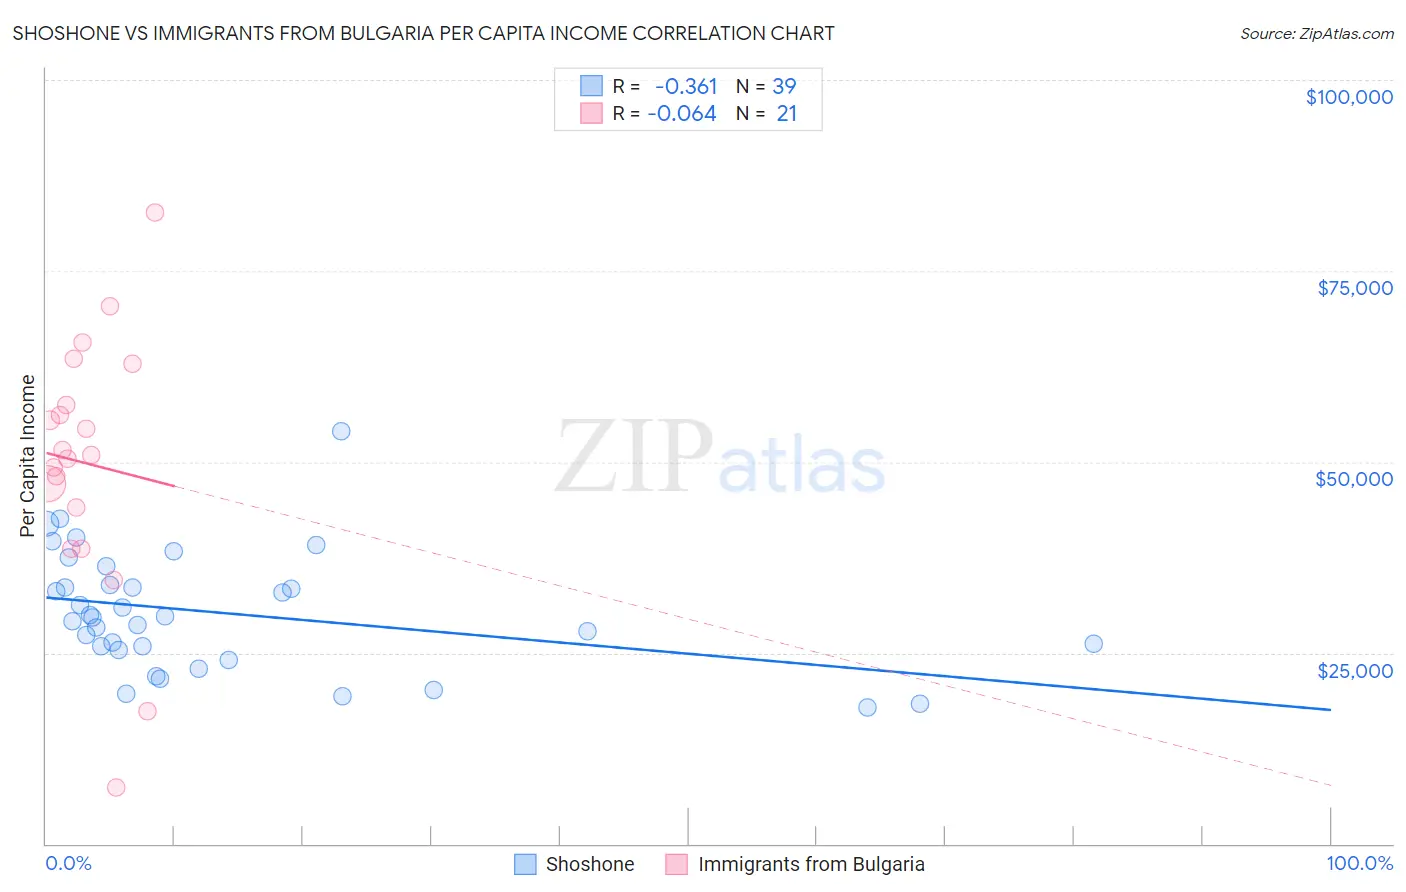
Shoshone vs Immigrants from Bulgaria Per Capita Income Correlation Chart

The statistical analysis conducted on geographies consisting of 66,627,177 people shows a mild negative correlation between the proportion of Shoshone and per capita income in the United States with a correlation coefficient (R) of -0.361 and weighted average of $37,072. Similarly, the statistical analysis conducted on geographies consisting of 172,552,113 people shows a slight negative correlation between the proportion of Immigrants from Bulgaria and per capita income in the United States with a correlation coefficient (R) of -0.064 and weighted average of $49,482, a difference of 33.5%.
Shoshone vs Immigrants from Bulgaria Per Capita Income

Per Capita Income Correlation Summary

MeasurementShoshoneImmigrants from Bulgaria
Minimum$17,814$7,295
Maximum$54,019$82,704
Range$36,205$75,409
Mean$30,204$49,825
Median$29,691$50,915
Interquartile 25% (IQ1)$25,299$41,288
Interquartile 75% (IQ3)$33,868$60,205
Interquartile Range (IQR)$8,569$18,917
Standard Deviation (Sample)$7,800$16,836
Standard Deviation (Population)$7,700$16,430

Similar Demographics by Per Capita Income

Demographics Similar to Shoshone by Per Capita Income

In terms of per capita income, the demographic groups most similar to Shoshone are Paiute ($37,066, a difference of 0.020%), Ottawa ($37,101, a difference of 0.080%), Honduran ($37,031, a difference of 0.11%), Inupiat ($36,999, a difference of 0.20%), and Immigrants from Bahamas ($37,193, a difference of 0.33%).
DemographicsRating | RankPer Capita Income
Immigrants | Dominican Republic
0.1
/100
|
#295
Tragic
$37,306
Indonesians
0.1
/100
|
#296
Tragic
$37,300
Haitians
0.1
/100
|
#297
Tragic
$37,289
Immigrants | Caribbean
0.1
/100
|
#298
Tragic
$37,254
Cherokee
0.1
/100
|
#299
Tragic
$37,203
Immigrants | Bahamas
0.1
/100
|
#300
Tragic
$37,193
Ottawa
0.1
/100
|
#301
Tragic
$37,101
Shoshone
0.1
/100
|
#302
Tragic
$37,072
Paiute
0.1
/100
|
#303
Tragic
$37,066
Hondurans
0.1
/100
|
#304
Tragic
$37,031
Inupiat
0.1
/100
|
#305
Tragic
$36,999
Immigrants | Haiti
0.0
/100
|
#306
Tragic
$36,849
Immigrants | Latin America
0.0
/100
|
#307
Tragic
$36,823
Fijians
0.0
/100
|
#308
Tragic
$36,690
Immigrants | Honduras
0.0
/100
|
#309
Tragic
$36,665

Demographics Similar to Immigrants from Bulgaria by Per Capita Income

In terms of per capita income, the demographic groups most similar to Immigrants from Bulgaria are Immigrants from Romania ($49,463, a difference of 0.040%), Lithuanian ($49,448, a difference of 0.070%), Bolivian ($49,526, a difference of 0.090%), Immigrants from Canada ($49,412, a difference of 0.14%), and Immigrants from Argentina ($49,627, a difference of 0.29%).
DemographicsRating | RankPer Capita Income
Bhutanese
99.9
/100
|
#59
Exceptional
$49,894
Immigrants | Scotland
99.9
/100
|
#60
Exceptional
$49,893
Argentineans
99.9
/100
|
#61
Exceptional
$49,862
Immigrants | Asia
99.9
/100
|
#62
Exceptional
$49,741
Maltese
99.9
/100
|
#63
Exceptional
$49,640
Immigrants | Argentina
99.9
/100
|
#64
Exceptional
$49,627
Bolivians
99.9
/100
|
#65
Exceptional
$49,526
Immigrants | Bulgaria
99.9
/100
|
#66
Exceptional
$49,482
Immigrants | Romania
99.9
/100
|
#67
Exceptional
$49,463
Lithuanians
99.8
/100
|
#68
Exceptional
$49,448
Immigrants | Canada
99.8
/100
|
#69
Exceptional
$49,412
Immigrants | Eastern Europe
99.8
/100
|
#70
Exceptional
$49,316
Greeks
99.8
/100
|
#71
Exceptional
$49,309
Immigrants | Hungary
99.8
/100
|
#72
Exceptional
$49,303
Immigrants | North America
99.8
/100
|
#73
Exceptional
$49,302