Portuguese vs South American Indian Householder Income Over 65 years
COMPARE
Portuguese
South American Indian
Householder Income Over 65 years
Householder Income Over 65 years Comparison
Portuguese
South American Indians
$61,440
HOUSEHOLDER INCOME OVER 65 YEARS
62.1/ 100
METRIC RATING
160th/ 347
METRIC RANK
$62,215
HOUSEHOLDER INCOME OVER 65 YEARS
78.7/ 100
METRIC RATING
142nd/ 347
METRIC RANK
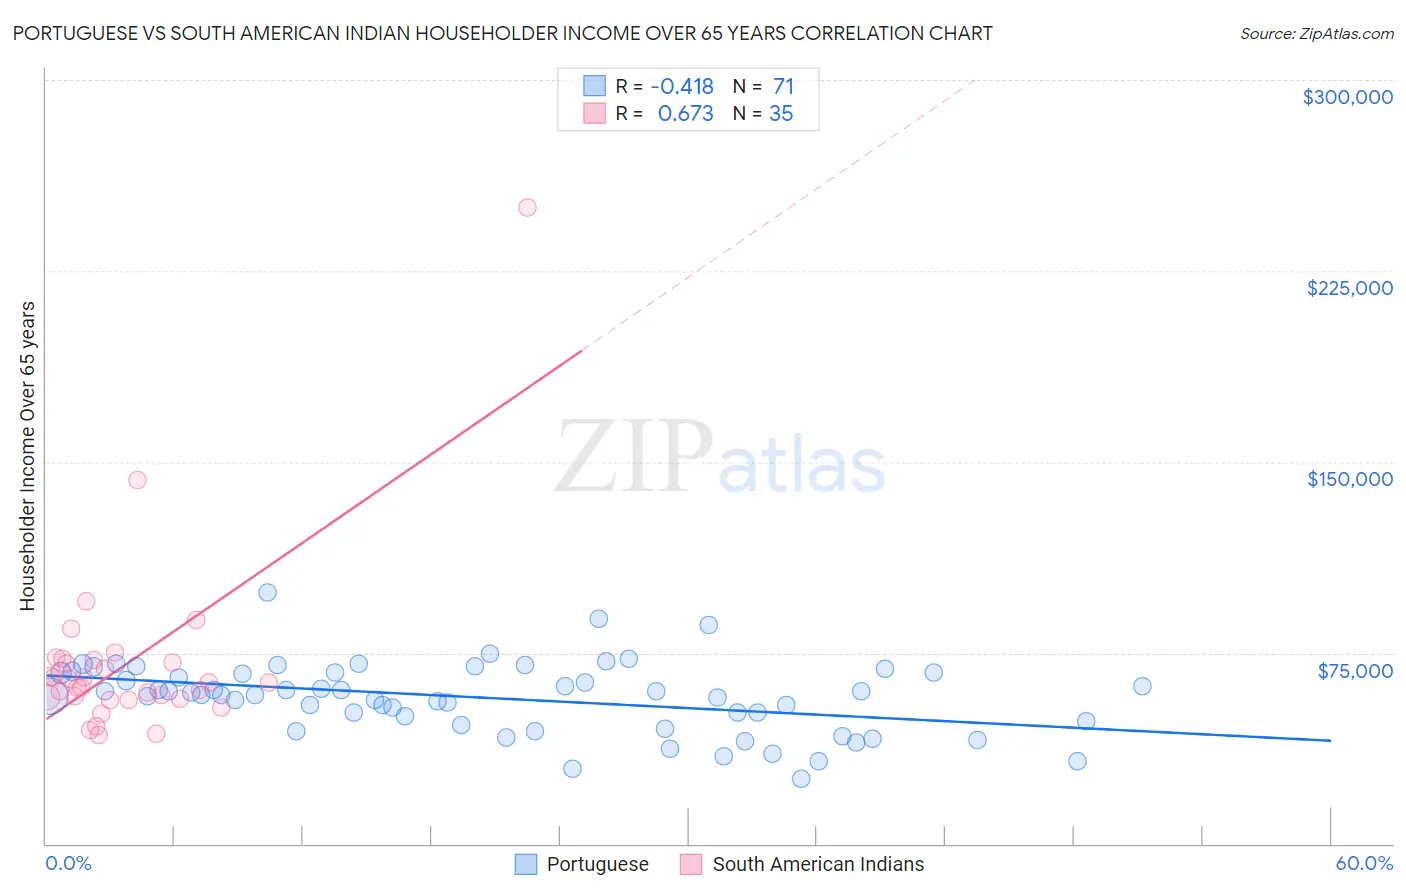
Portuguese vs South American Indian Householder Income Over 65 years Correlation Chart
The statistical analysis conducted on geographies consisting of 448,159,780 people shows a moderate negative correlation between the proportion of Portuguese and household income with householder over the age of 65 in the United States with a correlation coefficient (R) of -0.418 and weighted average of $61,440. Similarly, the statistical analysis conducted on geographies consisting of 164,391,818 people shows a significant positive correlation between the proportion of South American Indians and household income with householder over the age of 65 in the United States with a correlation coefficient (R) of 0.673 and weighted average of $62,215, a difference of 1.3%.
Householder Income Over 65 years Correlation Summary
| Measurement | Portuguese | South American Indian |
| Minimum | $25,525 | $42,500 |
| Maximum | $98,662 | $250,001 |
| Range | $73,137 | $207,501 |
| Mean | $57,386 | $70,859 |
| Median | $58,571 | $63,281 |
| Interquartile 25% (IQ1) | $48,306 | $56,818 |
| Interquartile 75% (IQ3) | $67,302 | $72,159 |
| Interquartile Range (IQR) | $18,996 | $15,341 |
| Standard Deviation (Sample) | $13,814 | $35,900 |
| Standard Deviation (Population) | $13,716 | $35,384 |
Demographics Similar to Portuguese and South American Indians by Householder Income Over 65 years
In terms of householder income over 65 years, the demographic groups most similar to Portuguese are Brazilian ($61,465, a difference of 0.040%), English ($61,487, a difference of 0.080%), Macedonian ($61,564, a difference of 0.20%), Scandinavian ($61,586, a difference of 0.24%), and Polish ($61,598, a difference of 0.26%). Similarly, the demographic groups most similar to South American Indians are Canadian ($62,230, a difference of 0.020%), Immigrants from Belarus ($62,162, a difference of 0.090%), Immigrants from Peru ($61,988, a difference of 0.37%), Immigrants from Uganda ($61,976, a difference of 0.39%), and Immigrants from Southern Europe ($61,902, a difference of 0.51%).
| Demographics | Rating | Rank | Householder Income Over 65 years |
| Canadians | 79.0 /100 | #141 | Good $62,230 |
| South American Indians | 78.7 /100 | #142 | Good $62,215 |
| Immigrants | Belarus | 77.8 /100 | #143 | Good $62,162 |
| Immigrants | Peru | 74.4 /100 | #144 | Good $61,988 |
| Immigrants | Uganda | 74.2 /100 | #145 | Good $61,976 |
| Immigrants | Southern Europe | 72.7 /100 | #146 | Good $61,902 |
| Immigrants | Nepal | 71.4 /100 | #147 | Good $61,843 |
| Alsatians | 70.5 /100 | #148 | Good $61,797 |
| Scottish | 69.1 /100 | #149 | Good $61,735 |
| Slavs | 68.5 /100 | #150 | Good $61,709 |
| Hungarians | 67.7 /100 | #151 | Good $61,673 |
| Armenians | 67.3 /100 | #152 | Good $61,656 |
| Costa Ricans | 66.9 /100 | #153 | Good $61,638 |
| Swiss | 66.5 /100 | #154 | Good $61,621 |
| Poles | 65.9 /100 | #155 | Good $61,598 |
| Scandinavians | 65.6 /100 | #156 | Good $61,586 |
| Macedonians | 65.1 /100 | #157 | Good $61,564 |
| English | 63.3 /100 | #158 | Good $61,487 |
| Brazilians | 62.7 /100 | #159 | Good $61,465 |
| Portuguese | 62.1 /100 | #160 | Good $61,440 |
| Icelanders | 57.9 /100 | #161 | Average $61,270 |