Puget Sound Salish vs South American Indian Householder Income Over 65 years
COMPARE
Puget Sound Salish
South American Indian
Householder Income Over 65 years
Householder Income Over 65 years Comparison
Puget Sound Salish
South American Indians
$59,934
HOUSEHOLDER INCOME OVER 65 YEARS
25.3/ 100
METRIC RATING
190th/ 347
METRIC RANK
$62,215
HOUSEHOLDER INCOME OVER 65 YEARS
78.7/ 100
METRIC RATING
142nd/ 347
METRIC RANK
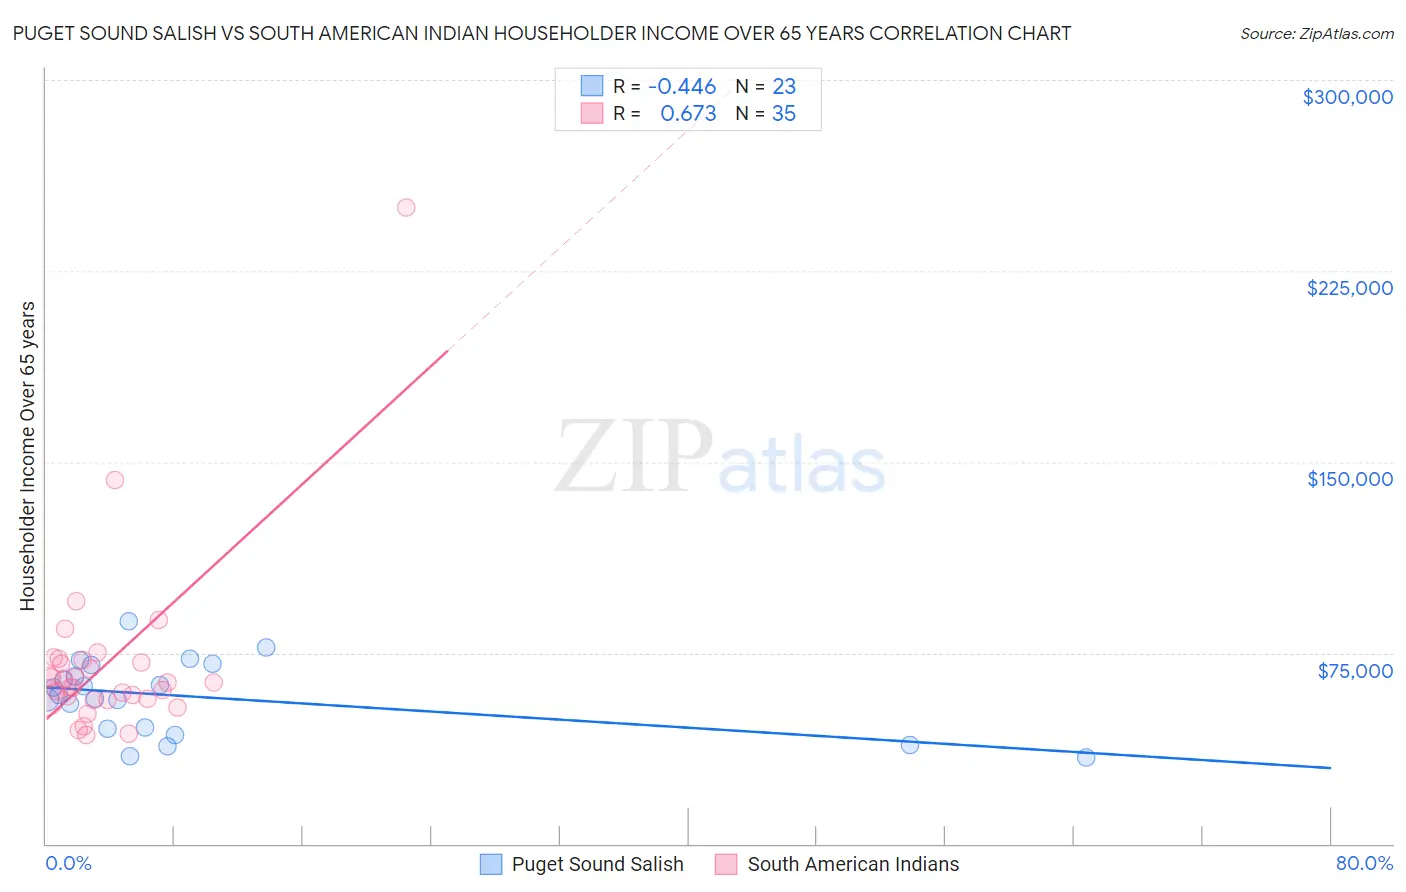
Puget Sound Salish vs South American Indian Householder Income Over 65 years Correlation Chart
The statistical analysis conducted on geographies consisting of 46,053,269 people shows a moderate negative correlation between the proportion of Puget Sound Salish and household income with householder over the age of 65 in the United States with a correlation coefficient (R) of -0.446 and weighted average of $59,934. Similarly, the statistical analysis conducted on geographies consisting of 164,391,818 people shows a significant positive correlation between the proportion of South American Indians and household income with householder over the age of 65 in the United States with a correlation coefficient (R) of 0.673 and weighted average of $62,215, a difference of 3.8%.
Householder Income Over 65 years Correlation Summary
| Measurement | Puget Sound Salish | South American Indian |
| Minimum | $33,750 | $42,500 |
| Maximum | $87,353 | $250,001 |
| Range | $53,603 | $207,501 |
| Mean | $57,757 | $70,859 |
| Median | $58,633 | $63,281 |
| Interquartile 25% (IQ1) | $44,987 | $56,818 |
| Interquartile 75% (IQ3) | $70,359 | $72,159 |
| Interquartile Range (IQR) | $25,372 | $15,341 |
| Standard Deviation (Sample) | $14,442 | $35,900 |
| Standard Deviation (Population) | $14,125 | $35,384 |
Similar Demographics by Householder Income Over 65 years
Demographics Similar to Puget Sound Salish by Householder Income Over 65 years
In terms of householder income over 65 years, the demographic groups most similar to Puget Sound Salish are Belgian ($59,915, a difference of 0.030%), South American ($59,854, a difference of 0.13%), Immigrants from Costa Rica ($59,848, a difference of 0.14%), Immigrants from Africa ($59,837, a difference of 0.16%), and Ghanaian ($60,043, a difference of 0.18%).
| Demographics | Rating | Rank | Householder Income Over 65 years |
| Kenyans | 38.4 /100 | #183 | Fair $60,514 |
| Iraqis | 37.2 /100 | #184 | Fair $60,466 |
| Albanians | 32.0 /100 | #185 | Fair $60,249 |
| Slovenes | 31.8 /100 | #186 | Fair $60,241 |
| Immigrants | Thailand | 31.3 /100 | #187 | Fair $60,217 |
| Immigrants | Eritrea | 28.6 /100 | #188 | Fair $60,096 |
| Ghanaians | 27.5 /100 | #189 | Fair $60,043 |
| Puget Sound Salish | 25.3 /100 | #190 | Fair $59,934 |
| Belgians | 24.9 /100 | #191 | Fair $59,915 |
| South Americans | 23.8 /100 | #192 | Fair $59,854 |
| Immigrants | Costa Rica | 23.6 /100 | #193 | Fair $59,848 |
| Immigrants | Africa | 23.4 /100 | #194 | Fair $59,837 |
| Immigrants | Iraq | 23.2 /100 | #195 | Fair $59,824 |
| Germans | 21.5 /100 | #196 | Fair $59,730 |
| Immigrants | Kenya | 21.1 /100 | #197 | Fair $59,710 |
Demographics Similar to South American Indians by Householder Income Over 65 years
In terms of householder income over 65 years, the demographic groups most similar to South American Indians are Canadian ($62,230, a difference of 0.020%), Arab ($62,266, a difference of 0.080%), Immigrants from Belarus ($62,162, a difference of 0.090%), Immigrants from Kazakhstan ($62,292, a difference of 0.12%), and Lebanese ($62,287, a difference of 0.12%).
| Demographics | Rating | Rank | Householder Income Over 65 years |
| Immigrants | Chile | 81.0 /100 | #135 | Excellent $62,354 |
| Alaskan Athabascans | 80.6 /100 | #136 | Excellent $62,330 |
| Immigrants | Syria | 80.2 /100 | #137 | Excellent $62,303 |
| Immigrants | Kazakhstan | 80.0 /100 | #138 | Excellent $62,292 |
| Lebanese | 79.9 /100 | #139 | Good $62,287 |
| Arabs | 79.6 /100 | #140 | Good $62,266 |
| Canadians | 79.0 /100 | #141 | Good $62,230 |
| South American Indians | 78.7 /100 | #142 | Good $62,215 |
| Immigrants | Belarus | 77.8 /100 | #143 | Good $62,162 |
| Immigrants | Peru | 74.4 /100 | #144 | Good $61,988 |
| Immigrants | Uganda | 74.2 /100 | #145 | Good $61,976 |
| Immigrants | Southern Europe | 72.7 /100 | #146 | Good $61,902 |
| Immigrants | Nepal | 71.4 /100 | #147 | Good $61,843 |
| Alsatians | 70.5 /100 | #148 | Good $61,797 |
| Scottish | 69.1 /100 | #149 | Good $61,735 |