Immigrants from Honduras vs Kenyan Householder Income Over 65 years
COMPARE
Immigrants from Honduras
Kenyan
Householder Income Over 65 years
Householder Income Over 65 years Comparison
Immigrants from Honduras
Kenyans
$51,888
HOUSEHOLDER INCOME OVER 65 YEARS
0.0/ 100
METRIC RATING
319th/ 347
METRIC RANK
$60,514
HOUSEHOLDER INCOME OVER 65 YEARS
38.4/ 100
METRIC RATING
183rd/ 347
METRIC RANK
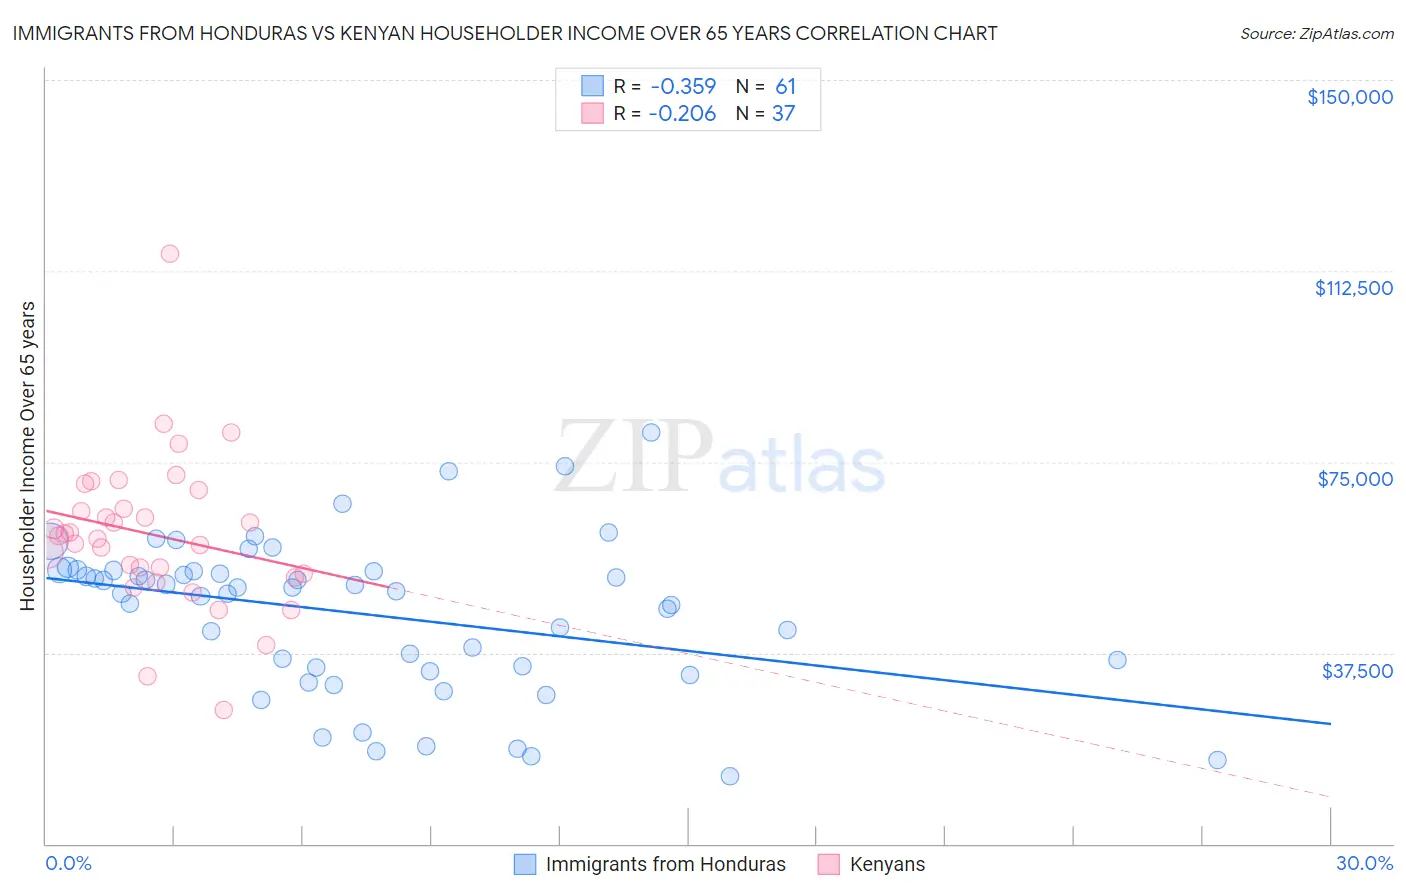
Immigrants from Honduras vs Kenyan Householder Income Over 65 years Correlation Chart
The statistical analysis conducted on geographies consisting of 321,788,463 people shows a mild negative correlation between the proportion of Immigrants from Honduras and household income with householder over the age of 65 in the United States with a correlation coefficient (R) of -0.359 and weighted average of $51,888. Similarly, the statistical analysis conducted on geographies consisting of 167,861,948 people shows a weak negative correlation between the proportion of Kenyans and household income with householder over the age of 65 in the United States with a correlation coefficient (R) of -0.206 and weighted average of $60,514, a difference of 16.6%.
Householder Income Over 65 years Correlation Summary
| Measurement | Immigrants from Honduras | Kenyan |
| Minimum | $13,371 | $26,155 |
| Maximum | $80,682 | $115,950 |
| Range | $67,311 | $89,795 |
| Mean | $45,102 | $60,697 |
| Median | $49,642 | $60,482 |
| Interquartile 25% (IQ1) | $34,344 | $52,723 |
| Interquartile 75% (IQ3) | $53,638 | $67,615 |
| Interquartile Range (IQR) | $19,294 | $14,892 |
| Standard Deviation (Sample) | $15,103 | $15,220 |
| Standard Deviation (Population) | $14,979 | $15,013 |
Similar Demographics by Householder Income Over 65 years
Demographics Similar to Immigrants from Honduras by Householder Income Over 65 years
In terms of householder income over 65 years, the demographic groups most similar to Immigrants from Honduras are Haitian ($51,912, a difference of 0.050%), Immigrants from St. Vincent and the Grenadines ($51,922, a difference of 0.070%), Creek ($51,949, a difference of 0.12%), Colville ($51,739, a difference of 0.29%), and Menominee ($51,719, a difference of 0.33%).
| Demographics | Rating | Rank | Householder Income Over 65 years |
| Immigrants | Azores | 0.0 /100 | #312 | Tragic $52,121 |
| Immigrants | Nicaragua | 0.0 /100 | #313 | Tragic $52,085 |
| Natives/Alaskans | 0.0 /100 | #314 | Tragic $52,081 |
| U.S. Virgin Islanders | 0.0 /100 | #315 | Tragic $52,072 |
| Creek | 0.0 /100 | #316 | Tragic $51,949 |
| Immigrants | St. Vincent and the Grenadines | 0.0 /100 | #317 | Tragic $51,922 |
| Haitians | 0.0 /100 | #318 | Tragic $51,912 |
| Immigrants | Honduras | 0.0 /100 | #319 | Tragic $51,888 |
| Colville | 0.0 /100 | #320 | Tragic $51,739 |
| Menominee | 0.0 /100 | #321 | Tragic $51,719 |
| British West Indians | 0.0 /100 | #322 | Tragic $51,463 |
| Cajuns | 0.0 /100 | #323 | Tragic $51,397 |
| Immigrants | Congo | 0.0 /100 | #324 | Tragic $51,393 |
| Immigrants | Haiti | 0.0 /100 | #325 | Tragic $51,219 |
| Kiowa | 0.0 /100 | #326 | Tragic $51,140 |
Demographics Similar to Kenyans by Householder Income Over 65 years
In terms of householder income over 65 years, the demographic groups most similar to Kenyans are Iraqi ($60,466, a difference of 0.080%), Czechoslovakian ($60,581, a difference of 0.11%), Celtic ($60,608, a difference of 0.15%), Immigrants from Morocco ($60,647, a difference of 0.22%), and Welsh ($60,666, a difference of 0.25%).
| Demographics | Rating | Rank | Householder Income Over 65 years |
| Spanish | 45.5 /100 | #176 | Average $60,795 |
| Alaska Natives | 44.3 /100 | #177 | Average $60,748 |
| Yup'ik | 43.7 /100 | #178 | Average $60,727 |
| Welsh | 42.2 /100 | #179 | Average $60,666 |
| Immigrants | Morocco | 41.7 /100 | #180 | Average $60,647 |
| Celtics | 40.7 /100 | #181 | Average $60,608 |
| Czechoslovakians | 40.0 /100 | #182 | Average $60,581 |
| Kenyans | 38.4 /100 | #183 | Fair $60,514 |
| Iraqis | 37.2 /100 | #184 | Fair $60,466 |
| Albanians | 32.0 /100 | #185 | Fair $60,249 |
| Slovenes | 31.8 /100 | #186 | Fair $60,241 |
| Immigrants | Thailand | 31.3 /100 | #187 | Fair $60,217 |
| Immigrants | Eritrea | 28.6 /100 | #188 | Fair $60,096 |
| Ghanaians | 27.5 /100 | #189 | Fair $60,043 |
| Puget Sound Salish | 25.3 /100 | #190 | Fair $59,934 |