South African vs Immigrants from Northern Africa Median Household Income
COMPARE
South African
Immigrants from Northern Africa
Median Household Income
Median Household Income Comparison
South Africans
Immigrants from Northern Africa
$93,379
MEDIAN HOUSEHOLD INCOME
99.5/ 100
METRIC RATING
76th/ 347
METRIC RANK
$90,026
MEDIAN HOUSEHOLD INCOME
95.9/ 100
METRIC RATING
114th/ 347
METRIC RANK
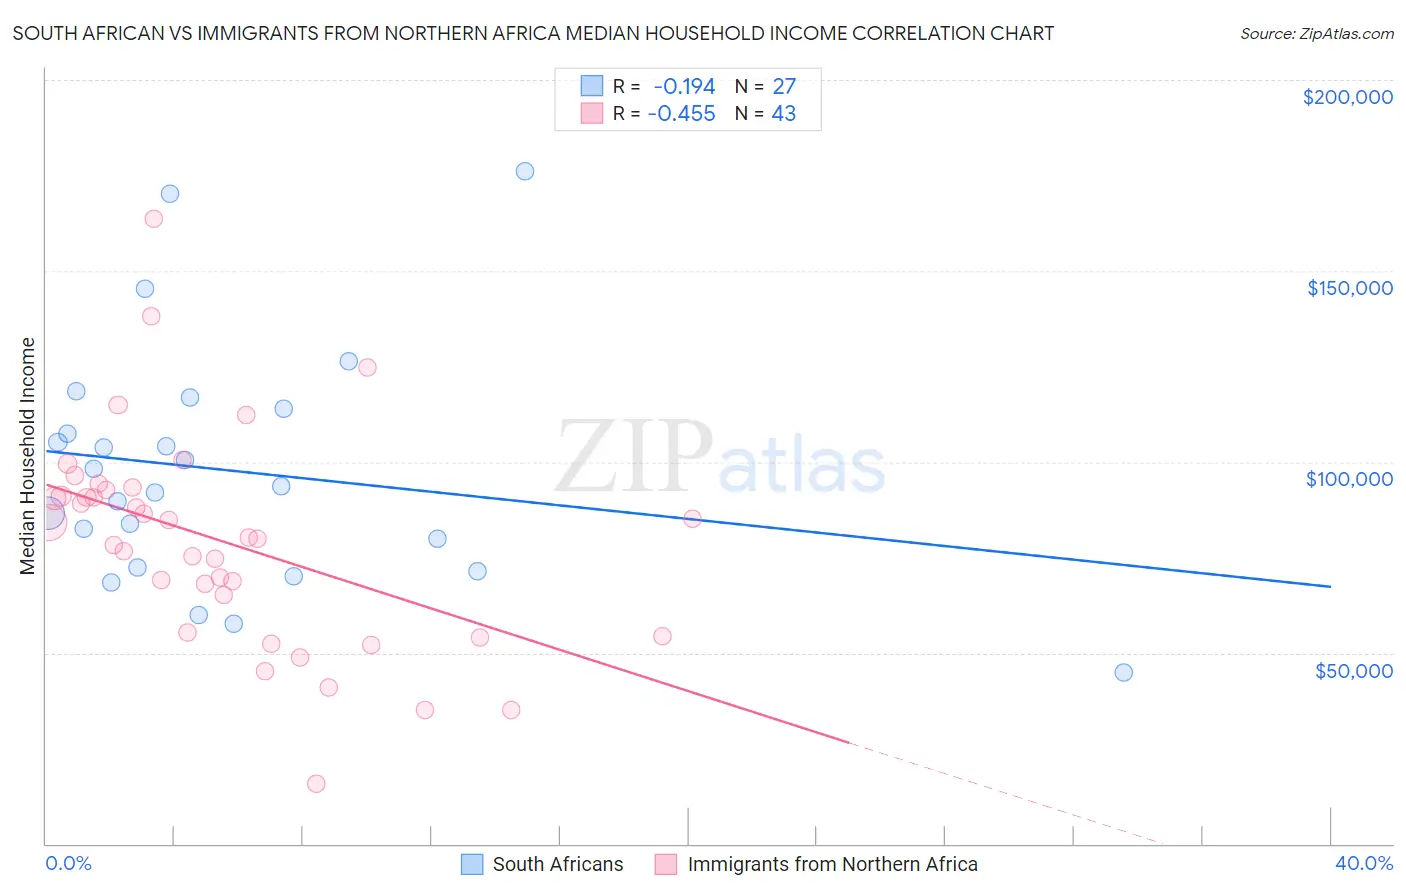
South African vs Immigrants from Northern Africa Median Household Income Correlation Chart
The statistical analysis conducted on geographies consisting of 182,537,527 people shows a poor negative correlation between the proportion of South Africans and median household income in the United States with a correlation coefficient (R) of -0.194 and weighted average of $93,379. Similarly, the statistical analysis conducted on geographies consisting of 321,059,386 people shows a moderate negative correlation between the proportion of Immigrants from Northern Africa and median household income in the United States with a correlation coefficient (R) of -0.455 and weighted average of $90,026, a difference of 3.7%.
Median Household Income Correlation Summary
| Measurement | South African | Immigrants from Northern Africa |
| Minimum | $45,000 | $15,682 |
| Maximum | $176,103 | $163,611 |
| Range | $131,103 | $147,929 |
| Mean | $97,725 | $79,183 |
| Median | $93,672 | $80,044 |
| Interquartile 25% (IQ1) | $72,324 | $55,170 |
| Interquartile 75% (IQ3) | $113,958 | $92,628 |
| Interquartile Range (IQR) | $41,634 | $37,458 |
| Standard Deviation (Sample) | $31,372 | $28,084 |
| Standard Deviation (Population) | $30,786 | $27,755 |
Similar Demographics by Median Household Income
Demographics Similar to South Africans by Median Household Income
In terms of median household income, the demographic groups most similar to South Africans are Immigrants from Afghanistan ($93,375, a difference of 0.0%), Immigrants from Italy ($93,465, a difference of 0.090%), Immigrants from Latvia ($93,602, a difference of 0.24%), Immigrants from Bulgaria ($93,148, a difference of 0.25%), and Sri Lankan ($93,093, a difference of 0.31%).
| Demographics | Rating | Rank | Median Household Income |
| Argentineans | 99.7 /100 | #69 | Exceptional $93,960 |
| Immigrants | Fiji | 99.7 /100 | #70 | Exceptional $93,933 |
| Immigrants | Philippines | 99.6 /100 | #71 | Exceptional $93,899 |
| Lithuanians | 99.6 /100 | #72 | Exceptional $93,852 |
| Immigrants | Egypt | 99.6 /100 | #73 | Exceptional $93,700 |
| Immigrants | Latvia | 99.6 /100 | #74 | Exceptional $93,602 |
| Immigrants | Italy | 99.5 /100 | #75 | Exceptional $93,465 |
| South Africans | 99.5 /100 | #76 | Exceptional $93,379 |
| Immigrants | Afghanistan | 99.5 /100 | #77 | Exceptional $93,375 |
| Immigrants | Bulgaria | 99.4 /100 | #78 | Exceptional $93,148 |
| Sri Lankans | 99.4 /100 | #79 | Exceptional $93,093 |
| Tongans | 99.4 /100 | #80 | Exceptional $93,076 |
| Immigrants | Eastern Europe | 99.4 /100 | #81 | Exceptional $93,051 |
| Immigrants | Spain | 99.3 /100 | #82 | Exceptional $92,732 |
| Italians | 99.1 /100 | #83 | Exceptional $92,475 |
Demographics Similar to Immigrants from Northern Africa by Median Household Income
In terms of median household income, the demographic groups most similar to Immigrants from Northern Africa are Immigrants from Western Asia ($90,005, a difference of 0.020%), Native Hawaiian ($89,919, a difference of 0.12%), Taiwanese ($89,900, a difference of 0.14%), Syrian ($89,830, a difference of 0.22%), and Peruvian ($90,261, a difference of 0.26%).
| Demographics | Rating | Rank | Median Household Income |
| Croatians | 97.3 /100 | #107 | Exceptional $90,685 |
| Zimbabweans | 97.2 /100 | #108 | Exceptional $90,618 |
| Chileans | 97.2 /100 | #109 | Exceptional $90,605 |
| Palestinians | 97.1 /100 | #110 | Exceptional $90,574 |
| Immigrants | Poland | 97.1 /100 | #111 | Exceptional $90,549 |
| Northern Europeans | 96.9 /100 | #112 | Exceptional $90,446 |
| Peruvians | 96.5 /100 | #113 | Exceptional $90,261 |
| Immigrants | Northern Africa | 95.9 /100 | #114 | Exceptional $90,026 |
| Immigrants | Western Asia | 95.9 /100 | #115 | Exceptional $90,005 |
| Native Hawaiians | 95.7 /100 | #116 | Exceptional $89,919 |
| Taiwanese | 95.6 /100 | #117 | Exceptional $89,900 |
| Syrians | 95.4 /100 | #118 | Exceptional $89,830 |
| Albanians | 95.2 /100 | #119 | Exceptional $89,744 |
| Immigrants | North Macedonia | 95.2 /100 | #120 | Exceptional $89,741 |
| Ethiopians | 94.9 /100 | #121 | Exceptional $89,640 |