Native/Alaskan vs Swiss Per Capita Income
COMPARE
Native/Alaskan
Swiss
Per Capita Income
Per Capita Income Comparison
Natives/Alaskans
Swiss
$33,279
PER CAPITA INCOME
0.0/ 100
METRIC RATING
334th/ 347
METRIC RANK
$44,076
PER CAPITA INCOME
61.4/ 100
METRIC RATING
162nd/ 347
METRIC RANK
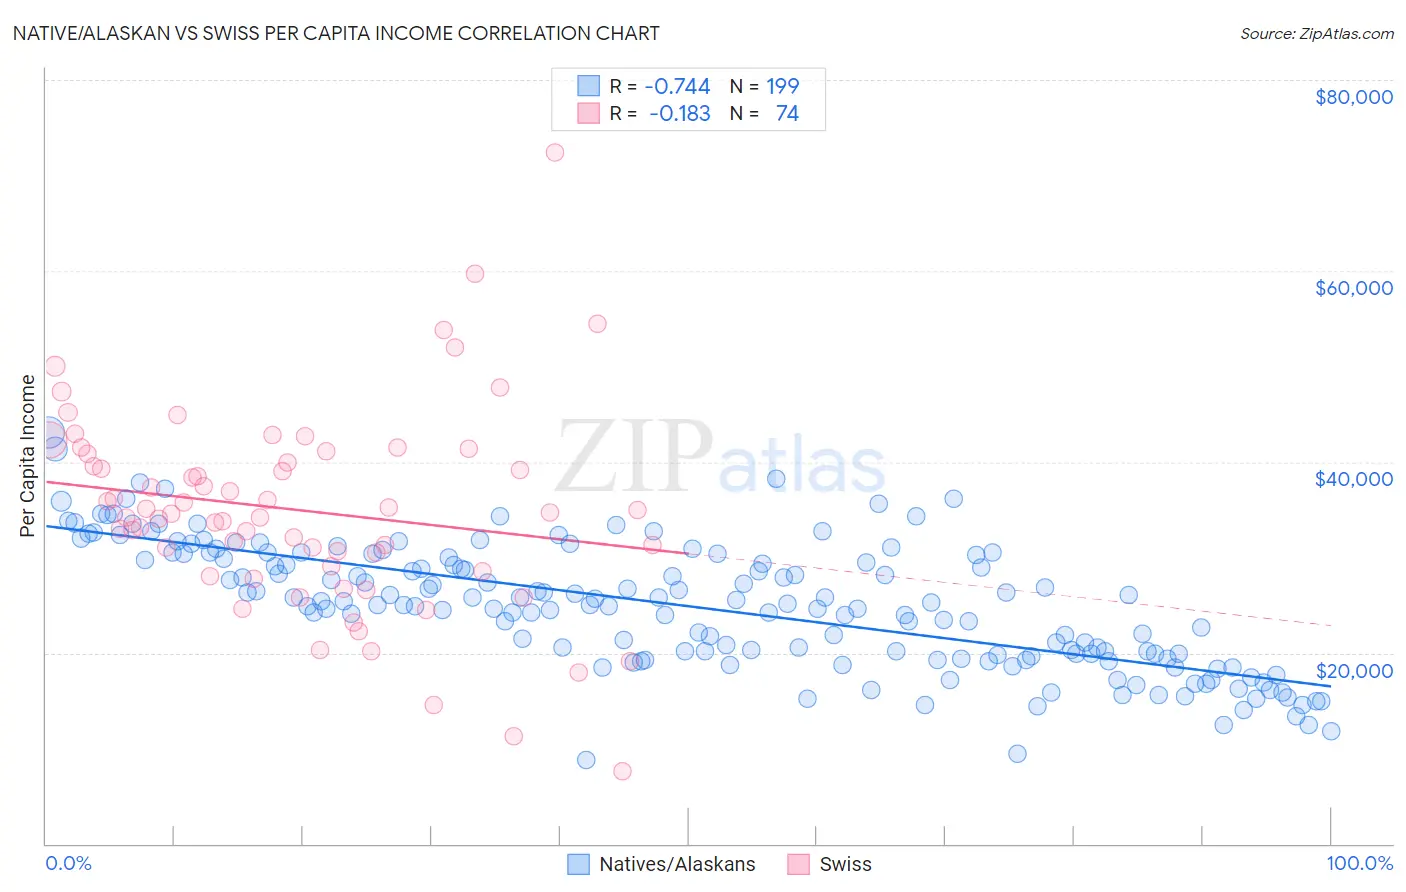
Native/Alaskan vs Swiss Per Capita Income Correlation Chart
The statistical analysis conducted on geographies consisting of 513,079,708 people shows a strong negative correlation between the proportion of Natives/Alaskans and per capita income in the United States with a correlation coefficient (R) of -0.744 and weighted average of $33,279. Similarly, the statistical analysis conducted on geographies consisting of 465,046,505 people shows a poor negative correlation between the proportion of Swiss and per capita income in the United States with a correlation coefficient (R) of -0.183 and weighted average of $44,076, a difference of 32.4%.
Per Capita Income Correlation Summary
| Measurement | Native/Alaskan | Swiss |
| Minimum | $8,837 | $7,533 |
| Maximum | $43,037 | $72,391 |
| Range | $34,200 | $64,858 |
| Mean | $24,883 | $34,911 |
| Median | $25,158 | $34,649 |
| Interquartile 25% (IQ1) | $19,735 | $29,057 |
| Interquartile 75% (IQ3) | $30,217 | $40,868 |
| Interquartile Range (IQR) | $10,482 | $11,811 |
| Standard Deviation (Sample) | $6,547 | $10,600 |
| Standard Deviation (Population) | $6,531 | $10,528 |
Similar Demographics by Per Capita Income
Demographics Similar to Natives/Alaskans by Per Capita Income
In terms of per capita income, the demographic groups most similar to Natives/Alaskans are Yuman ($33,236, a difference of 0.13%), Yakama ($33,009, a difference of 0.82%), Houma ($32,996, a difference of 0.86%), Immigrants from Yemen ($33,696, a difference of 1.3%), and Sioux ($33,921, a difference of 1.9%).
| Demographics | Rating | Rank | Per Capita Income |
| Apache | 0.0 /100 | #327 | Tragic $34,886 |
| Menominee | 0.0 /100 | #328 | Tragic $34,578 |
| Mexicans | 0.0 /100 | #329 | Tragic $34,559 |
| Spanish American Indians | 0.0 /100 | #330 | Tragic $34,195 |
| Immigrants | Mexico | 0.0 /100 | #331 | Tragic $33,931 |
| Sioux | 0.0 /100 | #332 | Tragic $33,921 |
| Immigrants | Yemen | 0.0 /100 | #333 | Tragic $33,696 |
| Natives/Alaskans | 0.0 /100 | #334 | Tragic $33,279 |
| Yuman | 0.0 /100 | #335 | Tragic $33,236 |
| Yakama | 0.0 /100 | #336 | Tragic $33,009 |
| Houma | 0.0 /100 | #337 | Tragic $32,996 |
| Arapaho | 0.0 /100 | #338 | Tragic $32,345 |
| Pueblo | 0.0 /100 | #339 | Tragic $32,012 |
| Crow | 0.0 /100 | #340 | Tragic $31,729 |
| Puerto Ricans | 0.0 /100 | #341 | Tragic $31,268 |
Demographics Similar to Swiss by Per Capita Income
In terms of per capita income, the demographic groups most similar to Swiss are Immigrants from South America ($44,068, a difference of 0.020%), Costa Rican ($44,090, a difference of 0.030%), Danish ($44,095, a difference of 0.040%), South American ($44,114, a difference of 0.090%), and Sri Lankan ($44,014, a difference of 0.14%).
| Demographics | Rating | Rank | Per Capita Income |
| Uruguayans | 67.6 /100 | #155 | Good $44,318 |
| Slovaks | 65.4 /100 | #156 | Good $44,229 |
| South American Indians | 64.8 /100 | #157 | Good $44,206 |
| Immigrants | Nepal | 64.3 /100 | #158 | Good $44,187 |
| South Americans | 62.4 /100 | #159 | Good $44,114 |
| Danes | 61.9 /100 | #160 | Good $44,095 |
| Costa Ricans | 61.8 /100 | #161 | Good $44,090 |
| Swiss | 61.4 /100 | #162 | Good $44,076 |
| Immigrants | South America | 61.2 /100 | #163 | Good $44,068 |
| Sri Lankans | 59.8 /100 | #164 | Average $44,014 |
| Immigrants | Philippines | 59.4 /100 | #165 | Average $44,000 |
| Immigrants | Uruguay | 59.3 /100 | #166 | Average $43,997 |
| English | 58.9 /100 | #167 | Average $43,982 |
| Belgians | 58.1 /100 | #168 | Average $43,951 |
| Immigrants | Peru | 55.3 /100 | #169 | Average $43,852 |