Ethiopian vs Swiss Per Capita Income
COMPARE
Ethiopian
Swiss
Per Capita Income
Per Capita Income Comparison
Ethiopians
Swiss
$46,569
PER CAPITA INCOME
96.3/ 100
METRIC RATING
106th/ 347
METRIC RANK
$44,076
PER CAPITA INCOME
61.4/ 100
METRIC RATING
162nd/ 347
METRIC RANK
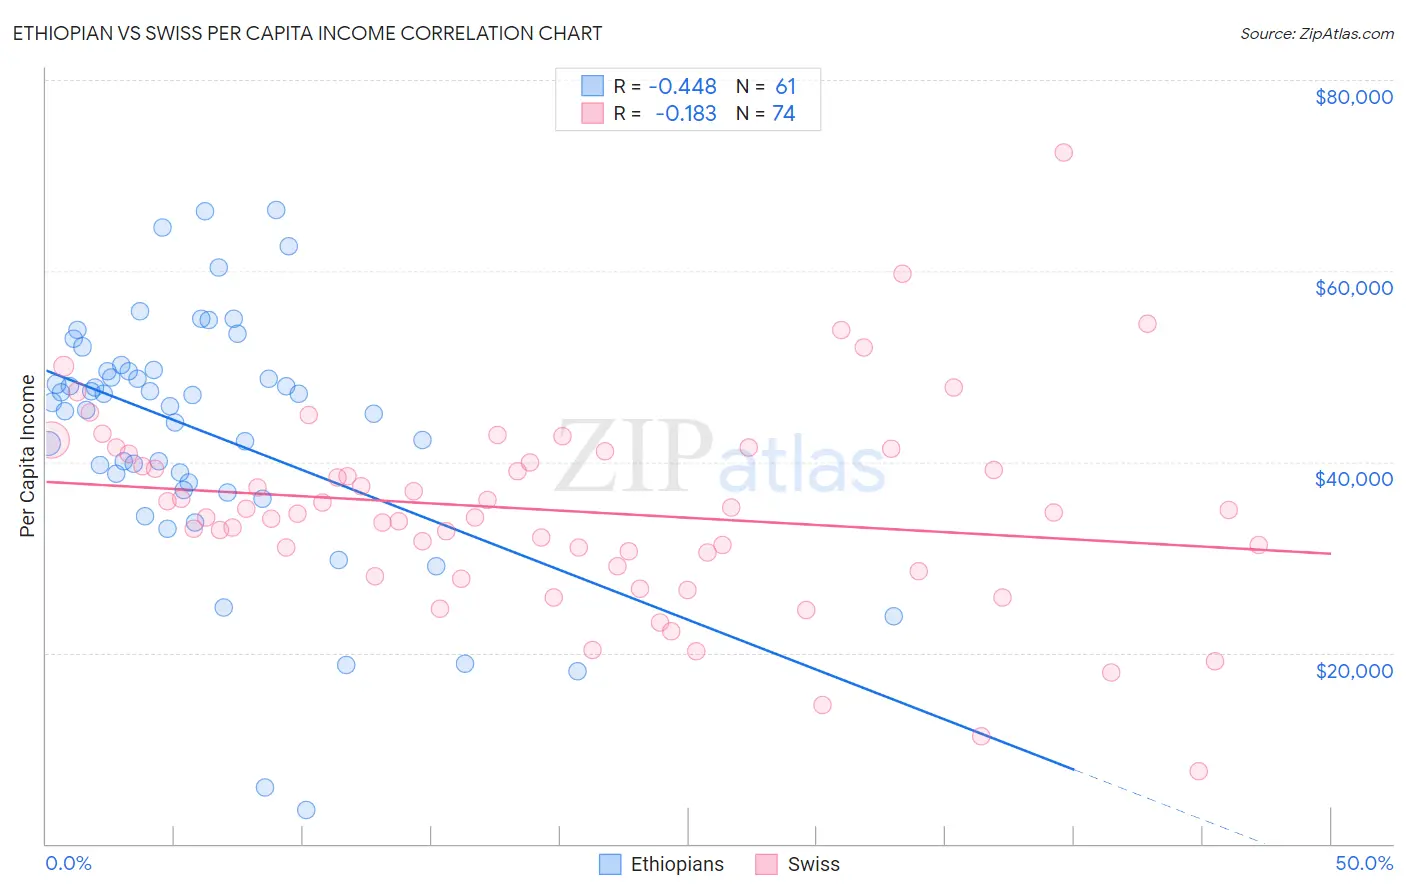
Ethiopian vs Swiss Per Capita Income Correlation Chart
The statistical analysis conducted on geographies consisting of 223,280,317 people shows a moderate negative correlation between the proportion of Ethiopians and per capita income in the United States with a correlation coefficient (R) of -0.448 and weighted average of $46,569. Similarly, the statistical analysis conducted on geographies consisting of 465,046,505 people shows a poor negative correlation between the proportion of Swiss and per capita income in the United States with a correlation coefficient (R) of -0.183 and weighted average of $44,076, a difference of 5.7%.
Per Capita Income Correlation Summary
| Measurement | Ethiopian | Swiss |
| Minimum | $3,511 | $7,533 |
| Maximum | $66,352 | $72,391 |
| Range | $62,841 | $64,858 |
| Mean | $43,114 | $34,911 |
| Median | $46,234 | $34,649 |
| Interquartile 25% (IQ1) | $37,442 | $29,057 |
| Interquartile 75% (IQ3) | $49,561 | $40,868 |
| Interquartile Range (IQR) | $12,119 | $11,811 |
| Standard Deviation (Sample) | $12,938 | $10,600 |
| Standard Deviation (Population) | $12,832 | $10,528 |
Similar Demographics by Per Capita Income
Demographics Similar to Ethiopians by Per Capita Income
In terms of per capita income, the demographic groups most similar to Ethiopians are British ($46,571, a difference of 0.0%), Serbian ($46,551, a difference of 0.040%), Immigrants from Kuwait ($46,543, a difference of 0.060%), Immigrants from Northern Africa ($46,531, a difference of 0.080%), and Chilean ($46,459, a difference of 0.24%).
| Demographics | Rating | Rank | Per Capita Income |
| Laotians | 97.8 /100 | #99 | Exceptional $47,041 |
| Immigrants | Lebanon | 97.5 /100 | #100 | Exceptional $46,938 |
| Immigrants | Uzbekistan | 97.5 /100 | #101 | Exceptional $46,929 |
| Immigrants | Western Asia | 97.4 /100 | #102 | Exceptional $46,876 |
| Syrians | 97.2 /100 | #103 | Exceptional $46,837 |
| Brazilians | 96.8 /100 | #104 | Exceptional $46,700 |
| British | 96.3 /100 | #105 | Exceptional $46,571 |
| Ethiopians | 96.3 /100 | #106 | Exceptional $46,569 |
| Serbians | 96.2 /100 | #107 | Exceptional $46,551 |
| Immigrants | Kuwait | 96.2 /100 | #108 | Exceptional $46,543 |
| Immigrants | Northern Africa | 96.2 /100 | #109 | Exceptional $46,531 |
| Chileans | 95.9 /100 | #110 | Exceptional $46,459 |
| Taiwanese | 95.8 /100 | #111 | Exceptional $46,455 |
| Immigrants | Morocco | 95.7 /100 | #112 | Exceptional $46,430 |
| Immigrants | Albania | 95.5 /100 | #113 | Exceptional $46,387 |
Demographics Similar to Swiss by Per Capita Income
In terms of per capita income, the demographic groups most similar to Swiss are Immigrants from South America ($44,068, a difference of 0.020%), Costa Rican ($44,090, a difference of 0.030%), Danish ($44,095, a difference of 0.040%), South American ($44,114, a difference of 0.090%), and Sri Lankan ($44,014, a difference of 0.14%).
| Demographics | Rating | Rank | Per Capita Income |
| Uruguayans | 67.6 /100 | #155 | Good $44,318 |
| Slovaks | 65.4 /100 | #156 | Good $44,229 |
| South American Indians | 64.8 /100 | #157 | Good $44,206 |
| Immigrants | Nepal | 64.3 /100 | #158 | Good $44,187 |
| South Americans | 62.4 /100 | #159 | Good $44,114 |
| Danes | 61.9 /100 | #160 | Good $44,095 |
| Costa Ricans | 61.8 /100 | #161 | Good $44,090 |
| Swiss | 61.4 /100 | #162 | Good $44,076 |
| Immigrants | South America | 61.2 /100 | #163 | Good $44,068 |
| Sri Lankans | 59.8 /100 | #164 | Average $44,014 |
| Immigrants | Philippines | 59.4 /100 | #165 | Average $44,000 |
| Immigrants | Uruguay | 59.3 /100 | #166 | Average $43,997 |
| English | 58.9 /100 | #167 | Average $43,982 |
| Belgians | 58.1 /100 | #168 | Average $43,951 |
| Immigrants | Peru | 55.3 /100 | #169 | Average $43,852 |