Immigrants from Poland vs Norwegian Householder Income Ages 45 - 64 years
COMPARE
Immigrants from Poland
Norwegian
Householder Income Ages 45 - 64 years
Householder Income Ages 45 - 64 years Comparison
Immigrants from Poland
Norwegians
$106,319
HOUSEHOLDER INCOME AGES 45 - 64 YEARS
95.3/ 100
METRIC RATING
114th/ 347
METRIC RANK
$103,682
HOUSEHOLDER INCOME AGES 45 - 64 YEARS
84.3/ 100
METRIC RATING
140th/ 347
METRIC RANK
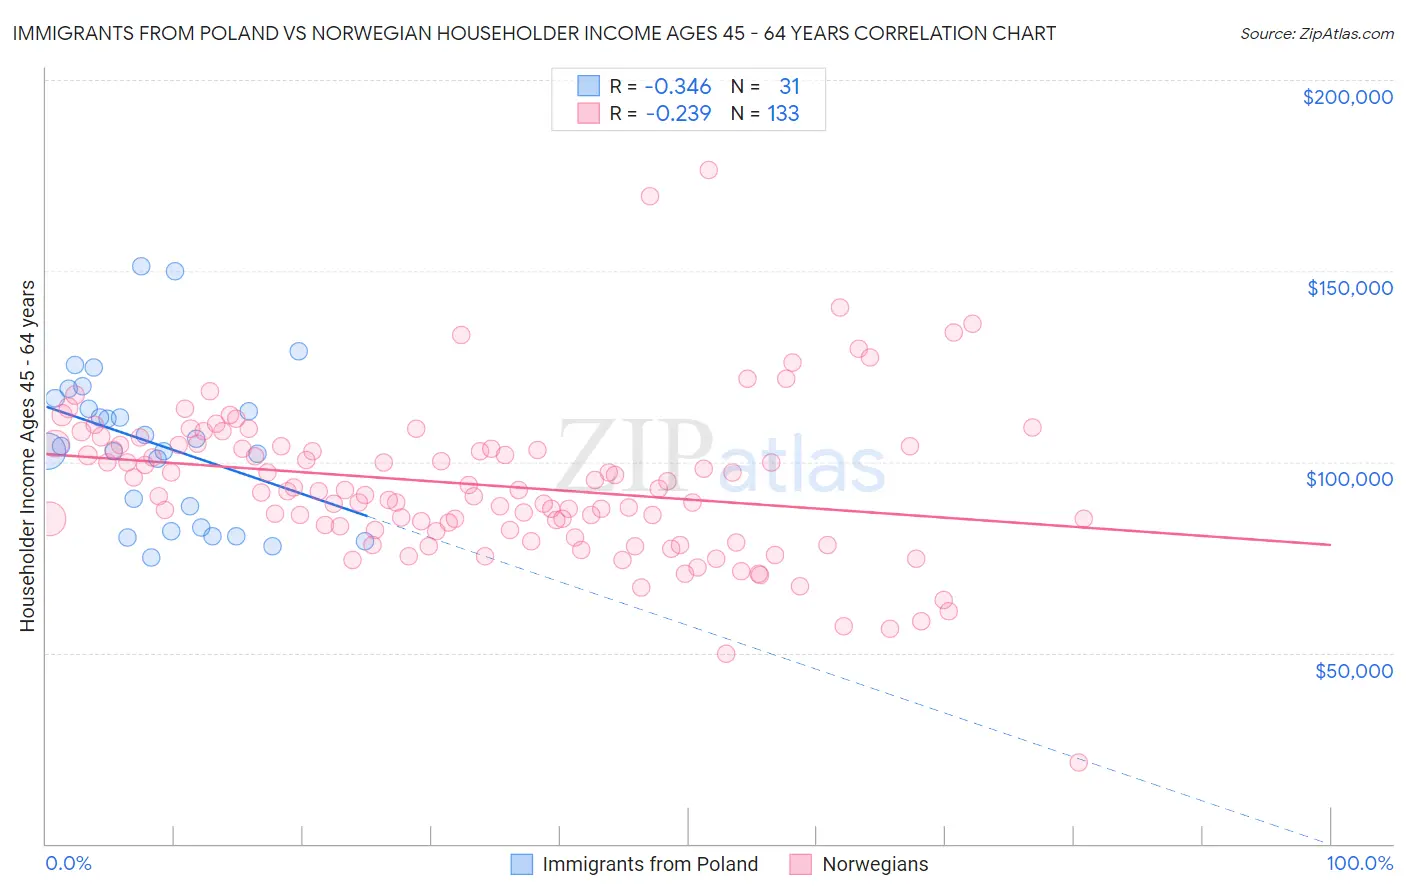
Immigrants from Poland vs Norwegian Householder Income Ages 45 - 64 years Correlation Chart
The statistical analysis conducted on geographies consisting of 304,578,268 people shows a mild negative correlation between the proportion of Immigrants from Poland and household income with householder between the ages 45 and 64 in the United States with a correlation coefficient (R) of -0.346 and weighted average of $106,319. Similarly, the statistical analysis conducted on geographies consisting of 530,964,543 people shows a weak negative correlation between the proportion of Norwegians and household income with householder between the ages 45 and 64 in the United States with a correlation coefficient (R) of -0.239 and weighted average of $103,682, a difference of 2.5%.
Householder Income Ages 45 - 64 years Correlation Summary
| Measurement | Immigrants from Poland | Norwegian |
| Minimum | $74,827 | $21,250 |
| Maximum | $151,262 | $176,301 |
| Range | $76,436 | $155,051 |
| Mean | $104,596 | $93,934 |
| Median | $104,115 | $92,185 |
| Interquartile 25% (IQ1) | $82,959 | $82,157 |
| Interquartile 75% (IQ3) | $116,688 | $104,273 |
| Interquartile Range (IQR) | $33,729 | $22,116 |
| Standard Deviation (Sample) | $20,034 | $20,569 |
| Standard Deviation (Population) | $19,708 | $20,492 |
Similar Demographics by Householder Income Ages 45 - 64 years
Demographics Similar to Immigrants from Poland by Householder Income Ages 45 - 64 years
In terms of householder income ages 45 - 64 years, the demographic groups most similar to Immigrants from Poland are Immigrants from Kuwait ($106,285, a difference of 0.030%), European ($106,367, a difference of 0.050%), British ($106,264, a difference of 0.050%), Swedish ($106,377, a difference of 0.060%), and Albanian ($106,243, a difference of 0.070%).
| Demographics | Rating | Rank | Householder Income Ages 45 - 64 years |
| Immigrants | Fiji | 96.5 /100 | #107 | Exceptional $106,952 |
| Zimbabweans | 96.3 /100 | #108 | Exceptional $106,849 |
| Chileans | 95.9 /100 | #109 | Exceptional $106,611 |
| Immigrants | Brazil | 95.6 /100 | #110 | Exceptional $106,470 |
| Immigrants | Vietnam | 95.5 /100 | #111 | Exceptional $106,417 |
| Swedes | 95.4 /100 | #112 | Exceptional $106,377 |
| Europeans | 95.4 /100 | #113 | Exceptional $106,367 |
| Immigrants | Poland | 95.3 /100 | #114 | Exceptional $106,319 |
| Immigrants | Kuwait | 95.2 /100 | #115 | Exceptional $106,285 |
| British | 95.2 /100 | #116 | Exceptional $106,264 |
| Albanians | 95.1 /100 | #117 | Exceptional $106,243 |
| Immigrants | Western Asia | 95.0 /100 | #118 | Exceptional $106,217 |
| Immigrants | Jordan | 94.9 /100 | #119 | Exceptional $106,164 |
| Immigrants | South Eastern Asia | 94.8 /100 | #120 | Exceptional $106,109 |
| Poles | 94.4 /100 | #121 | Exceptional $105,952 |
Demographics Similar to Norwegians by Householder Income Ages 45 - 64 years
In terms of householder income ages 45 - 64 years, the demographic groups most similar to Norwegians are Immigrants from Oceania ($103,705, a difference of 0.020%), Ethiopian ($103,736, a difference of 0.050%), Immigrants from Uganda ($103,584, a difference of 0.090%), Luxembourger ($103,536, a difference of 0.14%), and Serbian ($103,522, a difference of 0.15%).
| Demographics | Rating | Rank | Householder Income Ages 45 - 64 years |
| Arabs | 89.3 /100 | #133 | Excellent $104,566 |
| Canadians | 89.3 /100 | #134 | Excellent $104,560 |
| Brazilians | 88.6 /100 | #135 | Excellent $104,408 |
| Taiwanese | 87.4 /100 | #136 | Excellent $104,180 |
| Hungarians | 85.8 /100 | #137 | Excellent $103,913 |
| Ethiopians | 84.7 /100 | #138 | Excellent $103,736 |
| Immigrants | Oceania | 84.5 /100 | #139 | Excellent $103,705 |
| Norwegians | 84.3 /100 | #140 | Excellent $103,682 |
| Immigrants | Uganda | 83.7 /100 | #141 | Excellent $103,584 |
| Luxembourgers | 83.3 /100 | #142 | Excellent $103,536 |
| Serbians | 83.2 /100 | #143 | Excellent $103,522 |
| Czechs | 83.1 /100 | #144 | Excellent $103,507 |
| Ugandans | 82.9 /100 | #145 | Excellent $103,472 |
| Immigrants | Chile | 82.5 /100 | #146 | Excellent $103,412 |
| Basques | 82.3 /100 | #147 | Excellent $103,387 |