Immigrants from Bahamas vs Norwegian Householder Income Ages 45 - 64 years
COMPARE
Immigrants from Bahamas
Norwegian
Householder Income Ages 45 - 64 years
Householder Income Ages 45 - 64 years Comparison
Immigrants from Bahamas
Norwegians
$83,177
HOUSEHOLDER INCOME AGES 45 - 64 YEARS
0.0/ 100
METRIC RATING
311th/ 347
METRIC RANK
$103,682
HOUSEHOLDER INCOME AGES 45 - 64 YEARS
84.3/ 100
METRIC RATING
140th/ 347
METRIC RANK
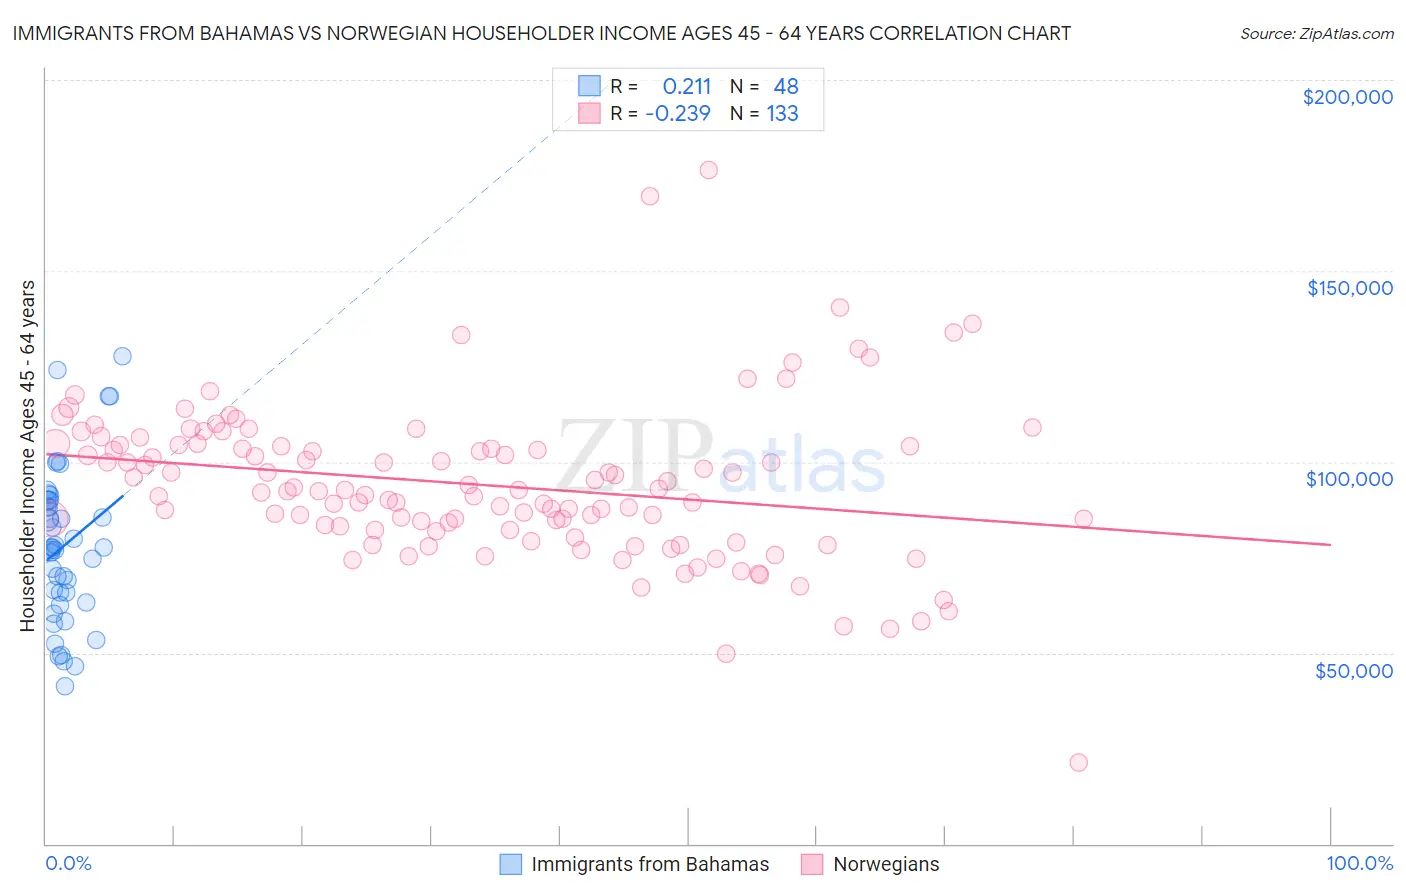
Immigrants from Bahamas vs Norwegian Householder Income Ages 45 - 64 years Correlation Chart
The statistical analysis conducted on geographies consisting of 104,531,402 people shows a weak positive correlation between the proportion of Immigrants from Bahamas and household income with householder between the ages 45 and 64 in the United States with a correlation coefficient (R) of 0.211 and weighted average of $83,177. Similarly, the statistical analysis conducted on geographies consisting of 530,964,543 people shows a weak negative correlation between the proportion of Norwegians and household income with householder between the ages 45 and 64 in the United States with a correlation coefficient (R) of -0.239 and weighted average of $103,682, a difference of 24.6%.
Householder Income Ages 45 - 64 years Correlation Summary
| Measurement | Immigrants from Bahamas | Norwegian |
| Minimum | $41,195 | $21,250 |
| Maximum | $127,688 | $176,301 |
| Range | $86,493 | $155,051 |
| Mean | $78,060 | $93,934 |
| Median | $77,570 | $92,185 |
| Interquartile 25% (IQ1) | $64,406 | $82,157 |
| Interquartile 75% (IQ3) | $89,869 | $104,273 |
| Interquartile Range (IQR) | $25,463 | $22,116 |
| Standard Deviation (Sample) | $20,104 | $20,569 |
| Standard Deviation (Population) | $19,893 | $20,492 |
Similar Demographics by Householder Income Ages 45 - 64 years
Demographics Similar to Immigrants from Bahamas by Householder Income Ages 45 - 64 years
In terms of householder income ages 45 - 64 years, the demographic groups most similar to Immigrants from Bahamas are Immigrants from Haiti ($83,257, a difference of 0.10%), Immigrants from Dominica ($83,311, a difference of 0.16%), Cajun ($83,015, a difference of 0.20%), Immigrants from Cabo Verde ($83,542, a difference of 0.44%), and Shoshone ($83,588, a difference of 0.49%).
| Demographics | Rating | Rank | Householder Income Ages 45 - 64 years |
| Ottawa | 0.0 /100 | #304 | Tragic $83,953 |
| Chippewa | 0.0 /100 | #305 | Tragic $83,943 |
| Ute | 0.0 /100 | #306 | Tragic $83,937 |
| Shoshone | 0.0 /100 | #307 | Tragic $83,588 |
| Immigrants | Cabo Verde | 0.0 /100 | #308 | Tragic $83,542 |
| Immigrants | Dominica | 0.0 /100 | #309 | Tragic $83,311 |
| Immigrants | Haiti | 0.0 /100 | #310 | Tragic $83,257 |
| Immigrants | Bahamas | 0.0 /100 | #311 | Tragic $83,177 |
| Cajuns | 0.0 /100 | #312 | Tragic $83,015 |
| U.S. Virgin Islanders | 0.0 /100 | #313 | Tragic $82,736 |
| Immigrants | Honduras | 0.0 /100 | #314 | Tragic $82,697 |
| Paiute | 0.0 /100 | #315 | Tragic $82,629 |
| Immigrants | Caribbean | 0.0 /100 | #316 | Tragic $82,513 |
| Colville | 0.0 /100 | #317 | Tragic $82,474 |
| Choctaw | 0.0 /100 | #318 | Tragic $82,287 |
Demographics Similar to Norwegians by Householder Income Ages 45 - 64 years
In terms of householder income ages 45 - 64 years, the demographic groups most similar to Norwegians are Immigrants from Oceania ($103,705, a difference of 0.020%), Ethiopian ($103,736, a difference of 0.050%), Immigrants from Uganda ($103,584, a difference of 0.090%), Luxembourger ($103,536, a difference of 0.14%), and Serbian ($103,522, a difference of 0.15%).
| Demographics | Rating | Rank | Householder Income Ages 45 - 64 years |
| Arabs | 89.3 /100 | #133 | Excellent $104,566 |
| Canadians | 89.3 /100 | #134 | Excellent $104,560 |
| Brazilians | 88.6 /100 | #135 | Excellent $104,408 |
| Taiwanese | 87.4 /100 | #136 | Excellent $104,180 |
| Hungarians | 85.8 /100 | #137 | Excellent $103,913 |
| Ethiopians | 84.7 /100 | #138 | Excellent $103,736 |
| Immigrants | Oceania | 84.5 /100 | #139 | Excellent $103,705 |
| Norwegians | 84.3 /100 | #140 | Excellent $103,682 |
| Immigrants | Uganda | 83.7 /100 | #141 | Excellent $103,584 |
| Luxembourgers | 83.3 /100 | #142 | Excellent $103,536 |
| Serbians | 83.2 /100 | #143 | Excellent $103,522 |
| Czechs | 83.1 /100 | #144 | Excellent $103,507 |
| Ugandans | 82.9 /100 | #145 | Excellent $103,472 |
| Immigrants | Chile | 82.5 /100 | #146 | Excellent $103,412 |
| Basques | 82.3 /100 | #147 | Excellent $103,387 |