Immigrants from North Macedonia vs Norwegian Householder Income Ages 45 - 64 years
COMPARE
Immigrants from North Macedonia
Norwegian
Householder Income Ages 45 - 64 years
Householder Income Ages 45 - 64 years Comparison
Immigrants from North Macedonia
Norwegians
$105,892
HOUSEHOLDER INCOME AGES 45 - 64 YEARS
94.2/ 100
METRIC RATING
122nd/ 347
METRIC RANK
$103,682
HOUSEHOLDER INCOME AGES 45 - 64 YEARS
84.3/ 100
METRIC RATING
140th/ 347
METRIC RANK
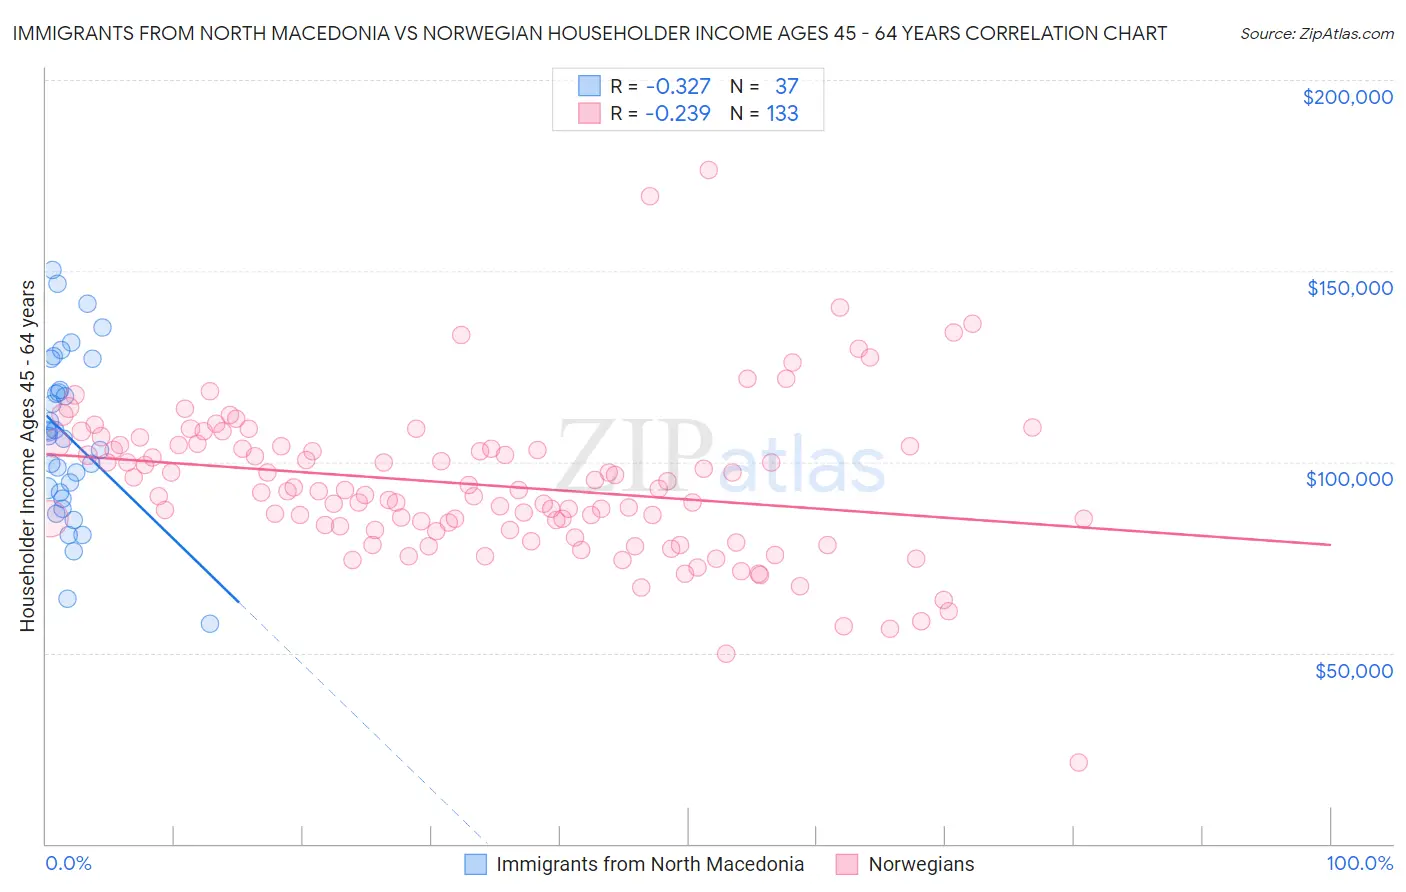
Immigrants from North Macedonia vs Norwegian Householder Income Ages 45 - 64 years Correlation Chart
The statistical analysis conducted on geographies consisting of 74,276,475 people shows a mild negative correlation between the proportion of Immigrants from North Macedonia and household income with householder between the ages 45 and 64 in the United States with a correlation coefficient (R) of -0.327 and weighted average of $105,892. Similarly, the statistical analysis conducted on geographies consisting of 530,964,543 people shows a weak negative correlation between the proportion of Norwegians and household income with householder between the ages 45 and 64 in the United States with a correlation coefficient (R) of -0.239 and weighted average of $103,682, a difference of 2.1%.
Householder Income Ages 45 - 64 years Correlation Summary
| Measurement | Immigrants from North Macedonia | Norwegian |
| Minimum | $57,692 | $21,250 |
| Maximum | $150,188 | $176,301 |
| Range | $92,496 | $155,051 |
| Mean | $106,443 | $93,934 |
| Median | $106,642 | $92,185 |
| Interquartile 25% (IQ1) | $91,237 | $82,157 |
| Interquartile 75% (IQ3) | $122,928 | $104,273 |
| Interquartile Range (IQR) | $31,692 | $22,116 |
| Standard Deviation (Sample) | $21,888 | $20,569 |
| Standard Deviation (Population) | $21,590 | $20,492 |
Demographics Similar to Immigrants from North Macedonia and Norwegians by Householder Income Ages 45 - 64 years
In terms of householder income ages 45 - 64 years, the demographic groups most similar to Immigrants from North Macedonia are Polish ($105,952, a difference of 0.060%), Danish ($105,619, a difference of 0.26%), Immigrants from Northern Africa ($105,430, a difference of 0.44%), Pakistani ($105,317, a difference of 0.55%), and Portuguese ($105,309, a difference of 0.55%). Similarly, the demographic groups most similar to Norwegians are Immigrants from Oceania ($103,705, a difference of 0.020%), Ethiopian ($103,736, a difference of 0.050%), Immigrants from Uganda ($103,584, a difference of 0.090%), Hungarian ($103,913, a difference of 0.22%), and Taiwanese ($104,180, a difference of 0.48%).
| Demographics | Rating | Rank | Householder Income Ages 45 - 64 years |
| Poles | 94.4 /100 | #121 | Exceptional $105,952 |
| Immigrants | North Macedonia | 94.2 /100 | #122 | Exceptional $105,892 |
| Danes | 93.4 /100 | #123 | Exceptional $105,619 |
| Immigrants | Northern Africa | 92.8 /100 | #124 | Exceptional $105,430 |
| Pakistanis | 92.4 /100 | #125 | Exceptional $105,317 |
| Portuguese | 92.4 /100 | #126 | Exceptional $105,309 |
| Immigrants | Saudi Arabia | 92.2 /100 | #127 | Exceptional $105,249 |
| Native Hawaiians | 91.8 /100 | #128 | Exceptional $105,149 |
| Peruvians | 91.5 /100 | #129 | Exceptional $105,070 |
| Immigrants | Zimbabwe | 91.2 /100 | #130 | Exceptional $104,992 |
| Immigrants | Syria | 90.7 /100 | #131 | Exceptional $104,858 |
| Lebanese | 90.1 /100 | #132 | Exceptional $104,734 |
| Arabs | 89.3 /100 | #133 | Excellent $104,566 |
| Canadians | 89.3 /100 | #134 | Excellent $104,560 |
| Brazilians | 88.6 /100 | #135 | Excellent $104,408 |
| Taiwanese | 87.4 /100 | #136 | Excellent $104,180 |
| Hungarians | 85.8 /100 | #137 | Excellent $103,913 |
| Ethiopians | 84.7 /100 | #138 | Excellent $103,736 |
| Immigrants | Oceania | 84.5 /100 | #139 | Excellent $103,705 |
| Norwegians | 84.3 /100 | #140 | Excellent $103,682 |
| Immigrants | Uganda | 83.7 /100 | #141 | Excellent $103,584 |