Slavic vs Lebanese Householder Income Over 65 years
COMPARE
Slavic
Lebanese
Householder Income Over 65 years
Householder Income Over 65 years Comparison
Slavs
Lebanese
$61,709
HOUSEHOLDER INCOME OVER 65 YEARS
68.5/ 100
METRIC RATING
150th/ 347
METRIC RANK
$62,287
HOUSEHOLDER INCOME OVER 65 YEARS
79.9/ 100
METRIC RATING
139th/ 347
METRIC RANK
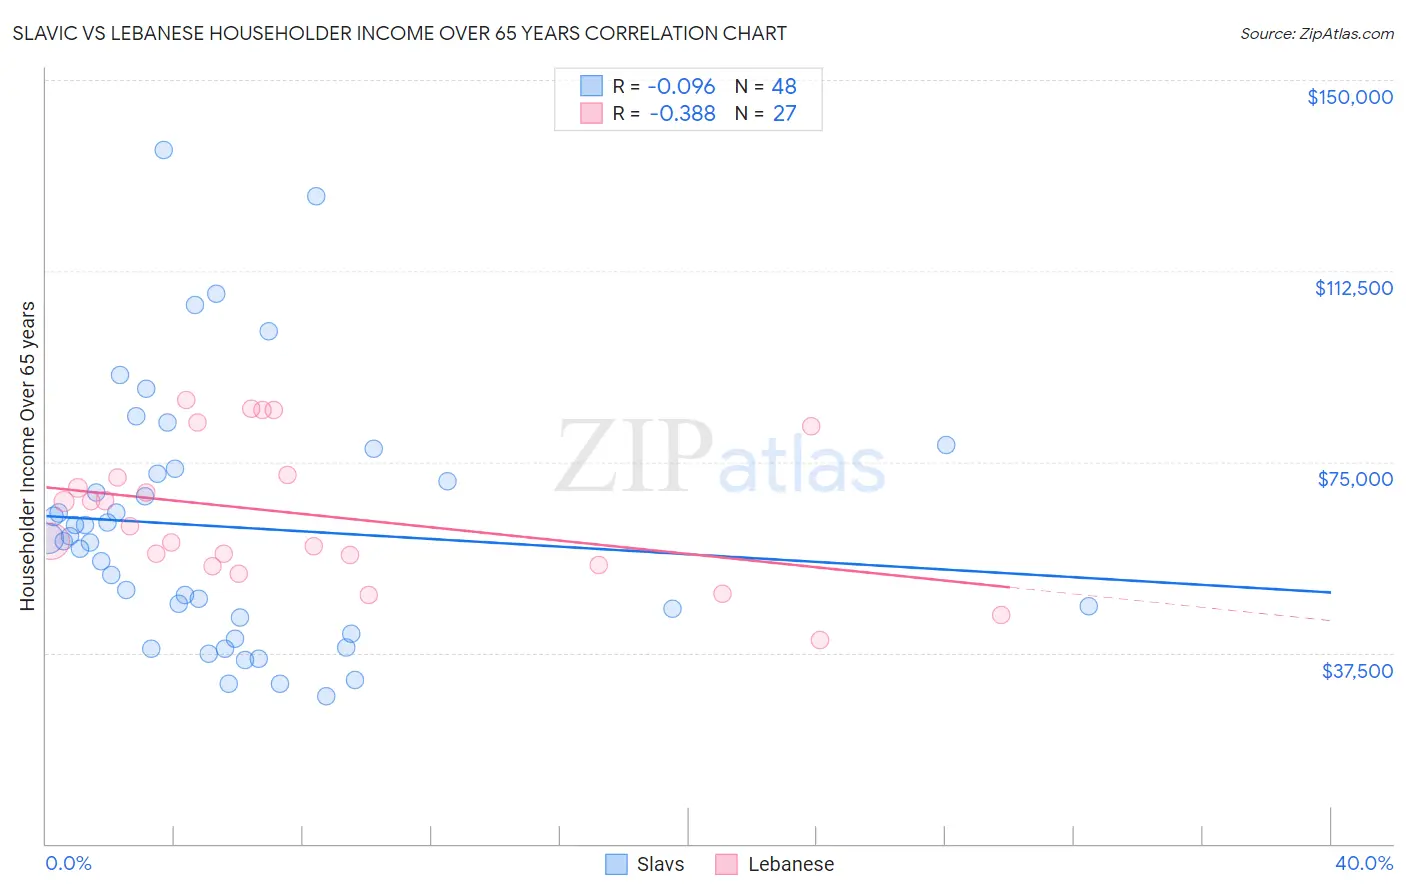
Slavic vs Lebanese Householder Income Over 65 years Correlation Chart
The statistical analysis conducted on geographies consisting of 270,416,943 people shows a slight negative correlation between the proportion of Slavs and household income with householder over the age of 65 in the United States with a correlation coefficient (R) of -0.096 and weighted average of $61,709. Similarly, the statistical analysis conducted on geographies consisting of 400,240,263 people shows a mild negative correlation between the proportion of Lebanese and household income with householder over the age of 65 in the United States with a correlation coefficient (R) of -0.388 and weighted average of $62,287, a difference of 0.94%.
Householder Income Over 65 years Correlation Summary
| Measurement | Slavic | Lebanese |
| Minimum | $29,063 | $39,905 |
| Maximum | $136,135 | $87,260 |
| Range | $107,072 | $47,355 |
| Mean | $62,217 | $64,724 |
| Median | $59,730 | $62,393 |
| Interquartile 25% (IQ1) | $42,874 | $54,830 |
| Interquartile 75% (IQ3) | $73,140 | $72,386 |
| Interquartile Range (IQR) | $30,267 | $17,556 |
| Standard Deviation (Sample) | $24,786 | $13,483 |
| Standard Deviation (Population) | $24,526 | $13,231 |
Demographics Similar to Slavs and Lebanese by Householder Income Over 65 years
In terms of householder income over 65 years, the demographic groups most similar to Slavs are Scottish ($61,735, a difference of 0.040%), Hungarian ($61,673, a difference of 0.060%), Armenian ($61,656, a difference of 0.090%), Costa Rican ($61,638, a difference of 0.12%), and Alsatian ($61,797, a difference of 0.14%). Similarly, the demographic groups most similar to Lebanese are Immigrants from Kazakhstan ($62,292, a difference of 0.010%), Immigrants from Syria ($62,303, a difference of 0.030%), Arab ($62,266, a difference of 0.030%), Alaskan Athabascan ($62,330, a difference of 0.070%), and Canadian ($62,230, a difference of 0.090%).
| Demographics | Rating | Rank | Householder Income Over 65 years |
| Immigrants | Brazil | 81.2 /100 | #134 | Excellent $62,364 |
| Immigrants | Chile | 81.0 /100 | #135 | Excellent $62,354 |
| Alaskan Athabascans | 80.6 /100 | #136 | Excellent $62,330 |
| Immigrants | Syria | 80.2 /100 | #137 | Excellent $62,303 |
| Immigrants | Kazakhstan | 80.0 /100 | #138 | Excellent $62,292 |
| Lebanese | 79.9 /100 | #139 | Good $62,287 |
| Arabs | 79.6 /100 | #140 | Good $62,266 |
| Canadians | 79.0 /100 | #141 | Good $62,230 |
| South American Indians | 78.7 /100 | #142 | Good $62,215 |
| Immigrants | Belarus | 77.8 /100 | #143 | Good $62,162 |
| Immigrants | Peru | 74.4 /100 | #144 | Good $61,988 |
| Immigrants | Uganda | 74.2 /100 | #145 | Good $61,976 |
| Immigrants | Southern Europe | 72.7 /100 | #146 | Good $61,902 |
| Immigrants | Nepal | 71.4 /100 | #147 | Good $61,843 |
| Alsatians | 70.5 /100 | #148 | Good $61,797 |
| Scottish | 69.1 /100 | #149 | Good $61,735 |
| Slavs | 68.5 /100 | #150 | Good $61,709 |
| Hungarians | 67.7 /100 | #151 | Good $61,673 |
| Armenians | 67.3 /100 | #152 | Good $61,656 |
| Costa Ricans | 66.9 /100 | #153 | Good $61,638 |
| Swiss | 66.5 /100 | #154 | Good $61,621 |