Guyanese vs Dutch Householder Income Ages 45 - 64 years
COMPARE
Guyanese
Dutch
Householder Income Ages 45 - 64 years
Householder Income Ages 45 - 64 years Comparison
Guyanese
Dutch
$90,966
HOUSEHOLDER INCOME AGES 45 - 64 YEARS
0.9/ 100
METRIC RATING
245th/ 347
METRIC RANK
$99,650
HOUSEHOLDER INCOME AGES 45 - 64 YEARS
41.7/ 100
METRIC RATING
186th/ 347
METRIC RANK
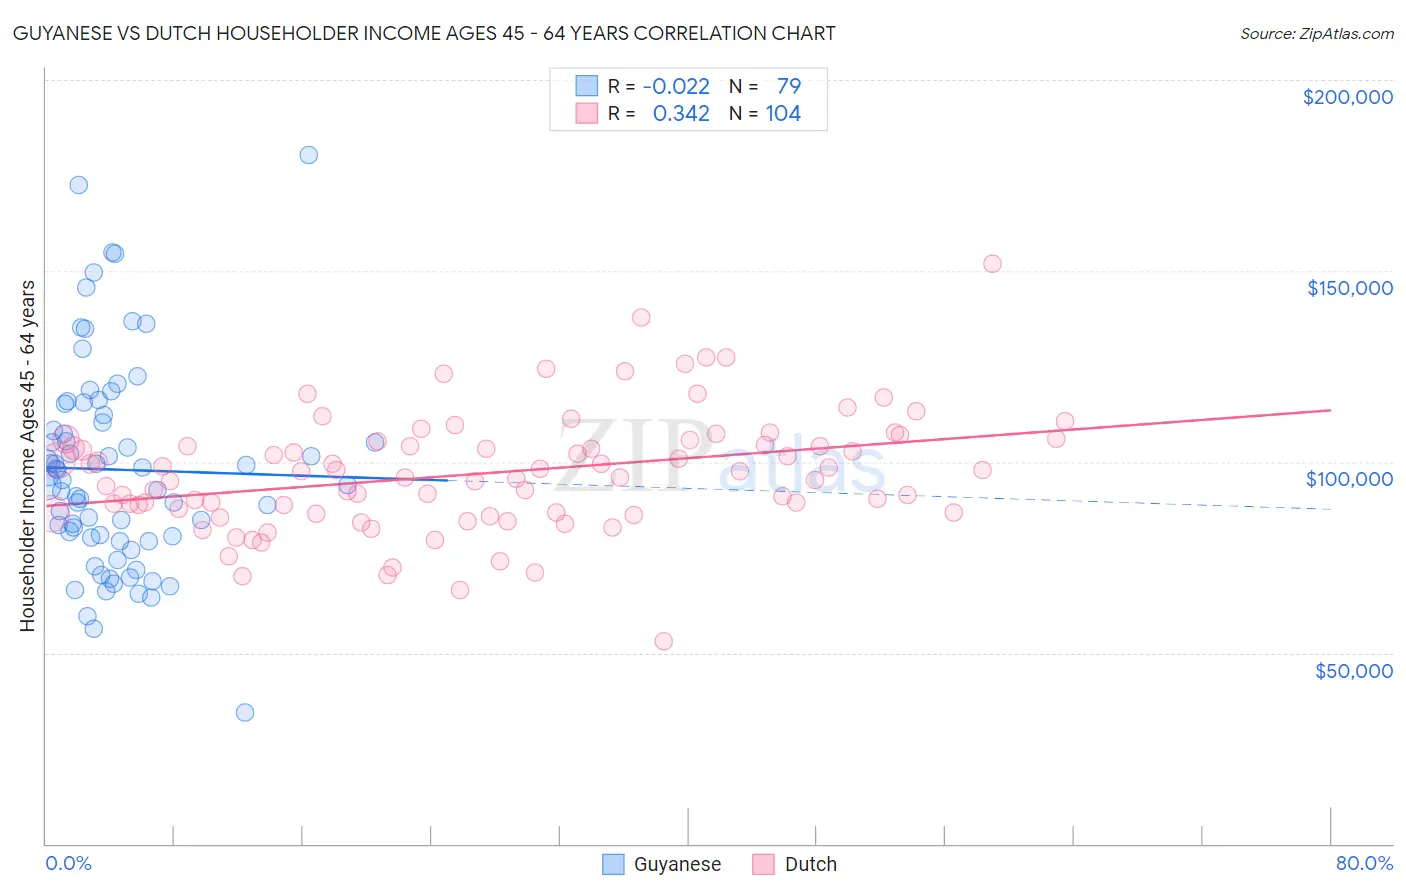
Guyanese vs Dutch Householder Income Ages 45 - 64 years Correlation Chart
The statistical analysis conducted on geographies consisting of 176,694,986 people shows no correlation between the proportion of Guyanese and household income with householder between the ages 45 and 64 in the United States with a correlation coefficient (R) of -0.022 and weighted average of $90,966. Similarly, the statistical analysis conducted on geographies consisting of 551,391,868 people shows a mild positive correlation between the proportion of Dutch and household income with householder between the ages 45 and 64 in the United States with a correlation coefficient (R) of 0.342 and weighted average of $99,650, a difference of 9.6%.
Householder Income Ages 45 - 64 years Correlation Summary
| Measurement | Guyanese | Dutch |
| Minimum | $34,531 | $53,125 |
| Maximum | $180,385 | $151,830 |
| Range | $145,854 | $98,705 |
| Mean | $97,960 | $96,972 |
| Median | $95,238 | $96,631 |
| Interquartile 25% (IQ1) | $80,177 | $86,774 |
| Interquartile 75% (IQ3) | $112,265 | $104,984 |
| Interquartile Range (IQR) | $32,087 | $18,210 |
| Standard Deviation (Sample) | $26,980 | $15,436 |
| Standard Deviation (Population) | $26,809 | $15,361 |
Similar Demographics by Householder Income Ages 45 - 64 years
Demographics Similar to Guyanese by Householder Income Ages 45 - 64 years
In terms of householder income ages 45 - 64 years, the demographic groups most similar to Guyanese are Central American ($90,951, a difference of 0.020%), Alaskan Athabascan ($90,951, a difference of 0.020%), Immigrants from Laos ($90,909, a difference of 0.060%), Mexican American Indian ($90,811, a difference of 0.17%), and Subsaharan African ($90,691, a difference of 0.30%).
| Demographics | Rating | Rank | Householder Income Ages 45 - 64 years |
| Pennsylvania Germans | 1.5 /100 | #238 | Tragic $91,956 |
| Immigrants | Ecuador | 1.2 /100 | #239 | Tragic $91,462 |
| Immigrants | Burma/Myanmar | 1.1 /100 | #240 | Tragic $91,385 |
| Trinidadians and Tobagonians | 1.1 /100 | #241 | Tragic $91,357 |
| Inupiat | 1.1 /100 | #242 | Tragic $91,355 |
| Immigrants | Trinidad and Tobago | 1.1 /100 | #243 | Tragic $91,347 |
| Immigrants | Middle Africa | 1.1 /100 | #244 | Tragic $91,293 |
| Guyanese | 0.9 /100 | #245 | Tragic $90,966 |
| Central Americans | 0.9 /100 | #246 | Tragic $90,951 |
| Alaskan Athabascans | 0.9 /100 | #247 | Tragic $90,951 |
| Immigrants | Laos | 0.9 /100 | #248 | Tragic $90,909 |
| Mexican American Indians | 0.8 /100 | #249 | Tragic $90,811 |
| Sub-Saharan Africans | 0.8 /100 | #250 | Tragic $90,691 |
| Americans | 0.7 /100 | #251 | Tragic $90,536 |
| Marshallese | 0.7 /100 | #252 | Tragic $90,455 |
Demographics Similar to Dutch by Householder Income Ages 45 - 64 years
In terms of householder income ages 45 - 64 years, the demographic groups most similar to Dutch are Colombian ($99,772, a difference of 0.12%), French ($99,824, a difference of 0.17%), Spaniard ($99,889, a difference of 0.24%), Finnish ($99,904, a difference of 0.25%), and Iraqi ($99,387, a difference of 0.27%).
| Demographics | Rating | Rank | Householder Income Ages 45 - 64 years |
| Belgians | 46.7 /100 | #179 | Average $100,060 |
| Aleuts | 46.6 /100 | #180 | Average $100,052 |
| Immigrants | Immigrants | 45.3 /100 | #181 | Average $99,943 |
| Finns | 44.8 /100 | #182 | Average $99,904 |
| Spaniards | 44.6 /100 | #183 | Average $99,889 |
| French | 43.8 /100 | #184 | Average $99,824 |
| Colombians | 43.2 /100 | #185 | Average $99,772 |
| Dutch | 41.7 /100 | #186 | Average $99,650 |
| Iraqis | 38.5 /100 | #187 | Fair $99,387 |
| Immigrants | Portugal | 36.3 /100 | #188 | Fair $99,203 |
| Immigrants | South America | 35.4 /100 | #189 | Fair $99,126 |
| French Canadians | 35.1 /100 | #190 | Fair $99,093 |
| Kenyans | 33.7 /100 | #191 | Fair $98,970 |
| Celtics | 32.9 /100 | #192 | Fair $98,896 |
| Hawaiians | 31.6 /100 | #193 | Fair $98,778 |