Sioux vs Immigrants from Australia Seniors Poverty Over the Age of 65
COMPARE
Sioux
Immigrants from Australia
Seniors Poverty Over the Age of 65
Seniors Poverty Over the Age of 65 Comparison
Sioux
Immigrants from Australia
15.3%
SENIORS POVERTY OVER THE AGE OF 65
0.0/ 100
METRIC RATING
328th/ 347
METRIC RANK
10.5%
SENIORS POVERTY OVER THE AGE OF 65
85.1/ 100
METRIC RATING
137th/ 347
METRIC RANK
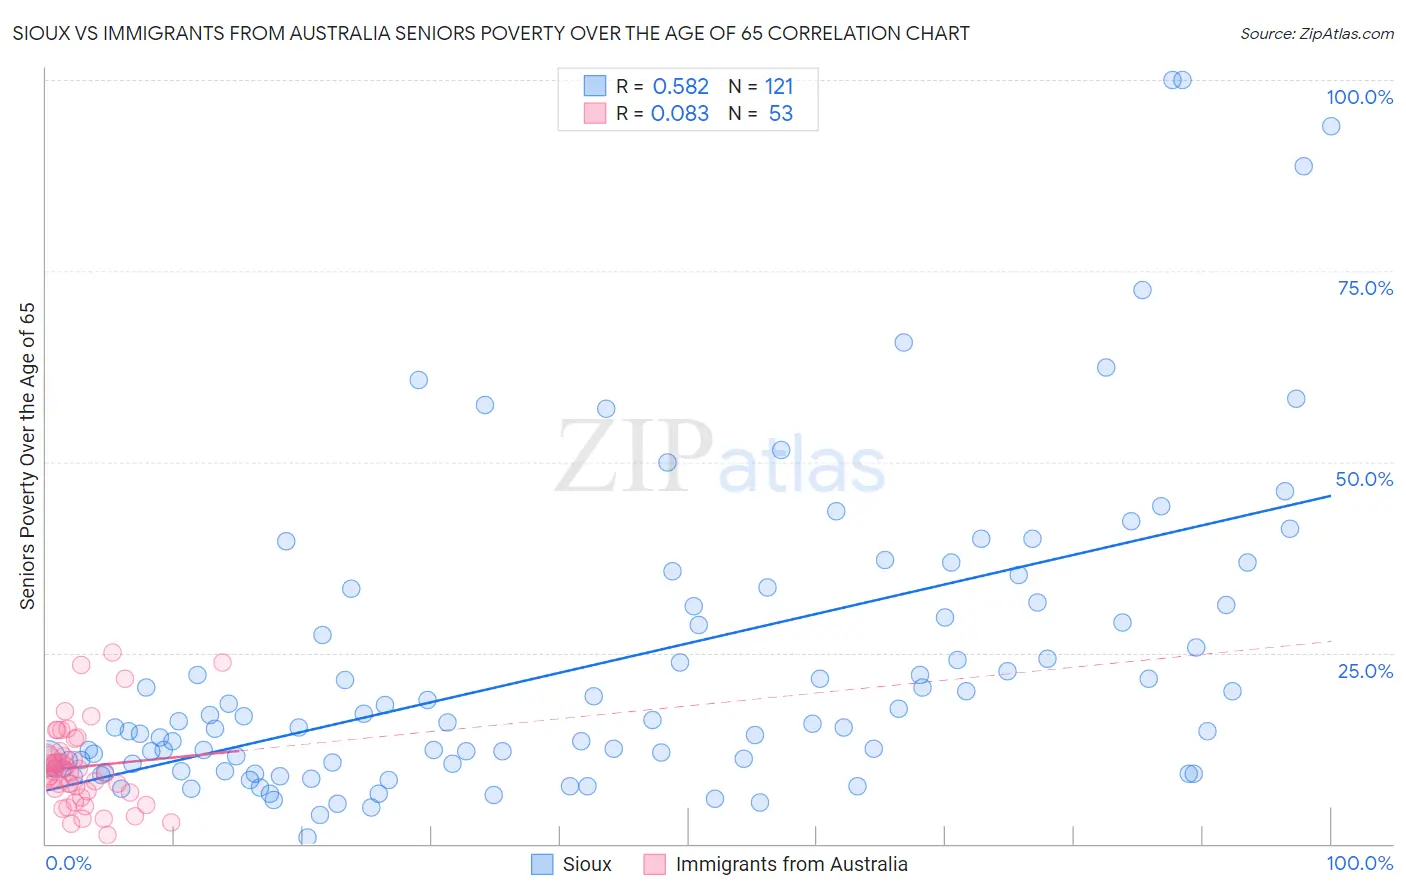
Sioux vs Immigrants from Australia Seniors Poverty Over the Age of 65 Correlation Chart
The statistical analysis conducted on geographies consisting of 233,565,707 people shows a substantial positive correlation between the proportion of Sioux and poverty level among seniors over the age of 65 in the United States with a correlation coefficient (R) of 0.582 and weighted average of 15.3%. Similarly, the statistical analysis conducted on geographies consisting of 226,798,964 people shows a slight positive correlation between the proportion of Immigrants from Australia and poverty level among seniors over the age of 65 in the United States with a correlation coefficient (R) of 0.083 and weighted average of 10.5%, a difference of 45.6%.
Seniors Poverty Over the Age of 65 Correlation Summary
| Measurement | Sioux | Immigrants from Australia |
| Minimum | 0.89% | 1.2% |
| Maximum | 100.0% | 25.0% |
| Range | 99.1% | 23.8% |
| Mean | 23.4% | 10.1% |
| Median | 15.7% | 9.5% |
| Interquartile 25% (IQ1) | 10.2% | 6.8% |
| Interquartile 75% (IQ3) | 31.2% | 11.9% |
| Interquartile Range (IQR) | 21.0% | 5.0% |
| Standard Deviation (Sample) | 20.2% | 5.4% |
| Standard Deviation (Population) | 20.1% | 5.3% |
Similar Demographics by Seniors Poverty Over the Age of 65
Demographics Similar to Sioux by Seniors Poverty Over the Age of 65
In terms of seniors poverty over the age of 65, the demographic groups most similar to Sioux are Crow (15.2%, a difference of 0.54%), Immigrants from Armenia (15.2%, a difference of 0.79%), Immigrants from Dominica (15.5%, a difference of 1.1%), Immigrants from St. Vincent and the Grenadines (15.5%, a difference of 1.4%), and Central American Indian (15.1%, a difference of 1.4%).
| Demographics | Rating | Rank | Seniors Poverty Over the Age of 65 |
| Houma | 0.0 /100 | #321 | Tragic 14.7% |
| Immigrants | Barbados | 0.0 /100 | #322 | Tragic 14.8% |
| Yakama | 0.0 /100 | #323 | Tragic 14.8% |
| Nicaraguans | 0.0 /100 | #324 | Tragic 15.0% |
| Central American Indians | 0.0 /100 | #325 | Tragic 15.1% |
| Immigrants | Armenia | 0.0 /100 | #326 | Tragic 15.2% |
| Crow | 0.0 /100 | #327 | Tragic 15.2% |
| Sioux | 0.0 /100 | #328 | Tragic 15.3% |
| Immigrants | Dominica | 0.0 /100 | #329 | Tragic 15.5% |
| Immigrants | St. Vincent and the Grenadines | 0.0 /100 | #330 | Tragic 15.5% |
| British West Indians | 0.0 /100 | #331 | Tragic 15.6% |
| Immigrants | Grenada | 0.0 /100 | #332 | Tragic 15.8% |
| Immigrants | Yemen | 0.0 /100 | #333 | Tragic 15.9% |
| Immigrants | Nicaragua | 0.0 /100 | #334 | Tragic 15.9% |
| Cubans | 0.0 /100 | #335 | Tragic 16.1% |
Demographics Similar to Immigrants from Australia by Seniors Poverty Over the Age of 65
In terms of seniors poverty over the age of 65, the demographic groups most similar to Immigrants from Australia are Immigrants from Latvia (10.5%, a difference of 0.060%), Portuguese (10.5%, a difference of 0.16%), Immigrants from Serbia (10.5%, a difference of 0.26%), Immigrants from Norway (10.5%, a difference of 0.27%), and Immigrants from Kenya (10.5%, a difference of 0.29%).
| Demographics | Rating | Rank | Seniors Poverty Over the Age of 65 |
| Immigrants | Oceania | 88.4 /100 | #130 | Excellent 10.4% |
| Egyptians | 87.8 /100 | #131 | Excellent 10.5% |
| Immigrants | Turkey | 87.7 /100 | #132 | Excellent 10.5% |
| Guamanians/Chamorros | 87.5 /100 | #133 | Excellent 10.5% |
| Sierra Leoneans | 86.8 /100 | #134 | Excellent 10.5% |
| Immigrants | Norway | 86.5 /100 | #135 | Excellent 10.5% |
| Immigrants | Serbia | 86.4 /100 | #136 | Excellent 10.5% |
| Immigrants | Australia | 85.1 /100 | #137 | Excellent 10.5% |
| Immigrants | Latvia | 84.7 /100 | #138 | Excellent 10.5% |
| Portuguese | 84.1 /100 | #139 | Excellent 10.5% |
| Immigrants | Kenya | 83.4 /100 | #140 | Excellent 10.5% |
| Immigrants | Europe | 83.3 /100 | #141 | Excellent 10.5% |
| Osage | 82.8 /100 | #142 | Excellent 10.6% |
| Immigrants | Asia | 80.8 /100 | #143 | Excellent 10.6% |
| Iraqis | 80.7 /100 | #144 | Excellent 10.6% |