Sioux vs Immigrants from Australia No Schooling Completed
COMPARE
Sioux
Immigrants from Australia
No Schooling Completed
No Schooling Completed Comparison
Sioux
Immigrants from Australia
1.8%
NO SCHOOLING COMPLETED
99.0/ 100
METRIC RATING
90th/ 347
METRIC RANK
1.7%
NO SCHOOLING COMPLETED
99.2/ 100
METRIC RATING
85th/ 347
METRIC RANK
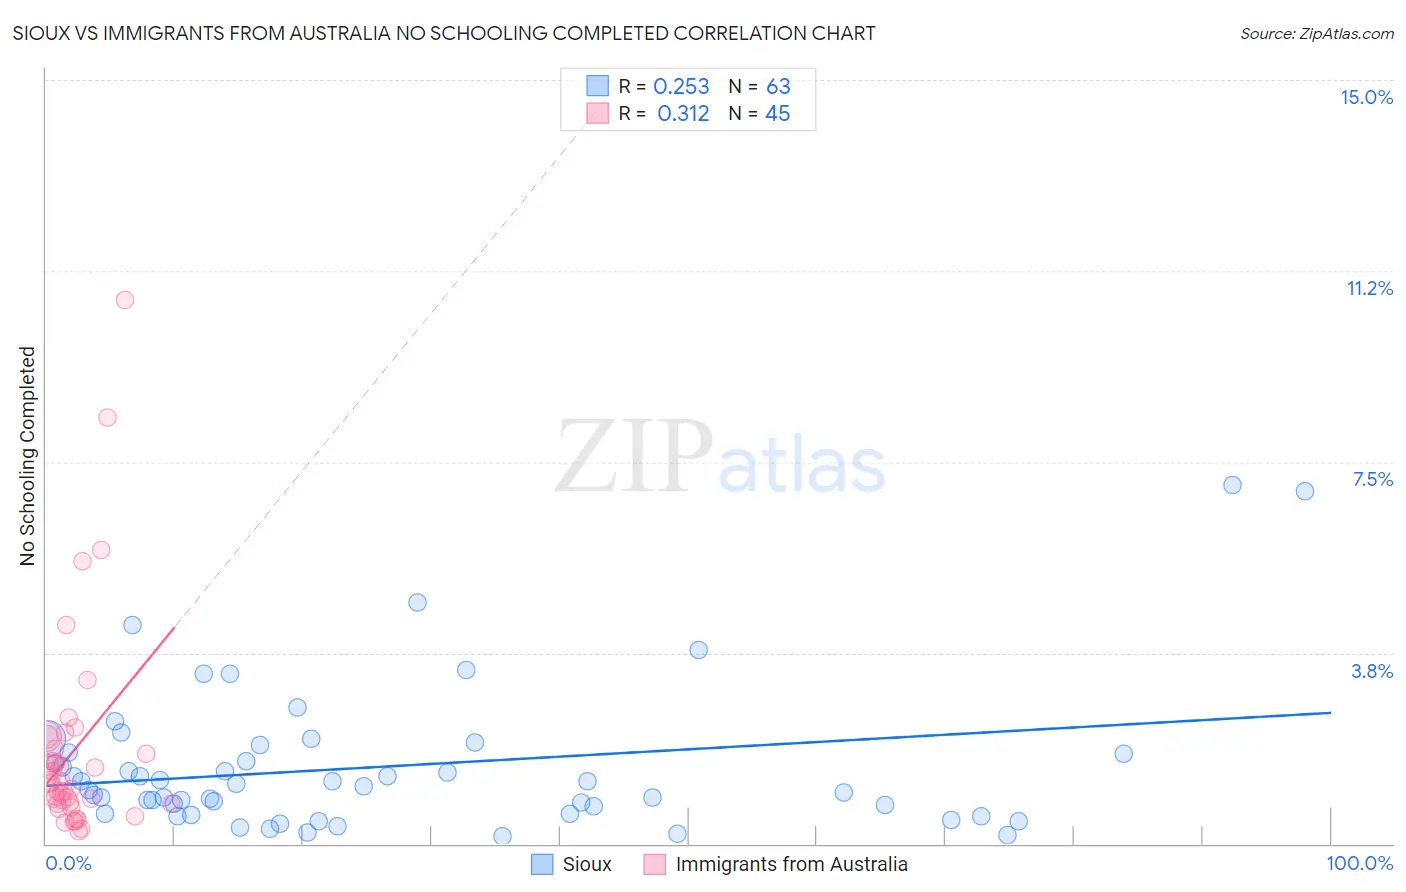
Sioux vs Immigrants from Australia No Schooling Completed Correlation Chart
The statistical analysis conducted on geographies consisting of 231,835,063 people shows a weak positive correlation between the proportion of Sioux and percentage of population with no schooling in the United States with a correlation coefficient (R) of 0.253 and weighted average of 1.8%. Similarly, the statistical analysis conducted on geographies consisting of 225,255,511 people shows a mild positive correlation between the proportion of Immigrants from Australia and percentage of population with no schooling in the United States with a correlation coefficient (R) of 0.312 and weighted average of 1.7%, a difference of 1.2%.
No Schooling Completed Correlation Summary
| Measurement | Sioux | Immigrants from Australia |
| Minimum | 0.14% | 0.24% |
| Maximum | 7.0% | 10.7% |
| Range | 6.9% | 10.4% |
| Mean | 1.5% | 1.8% |
| Median | 1.1% | 1.2% |
| Interquartile 25% (IQ1) | 0.60% | 0.79% |
| Interquartile 75% (IQ3) | 1.8% | 2.0% |
| Interquartile Range (IQR) | 1.2% | 1.2% |
| Standard Deviation (Sample) | 1.4% | 2.1% |
| Standard Deviation (Population) | 1.4% | 2.1% |
Demographics Similar to Sioux and Immigrants from Australia by No Schooling Completed
In terms of no schooling completed, the demographic groups most similar to Sioux are Immigrants from Germany (1.8%, a difference of 0.11%), Romanian (1.8%, a difference of 0.62%), South African (1.8%, a difference of 0.72%), Immigrants from Western Europe (1.8%, a difference of 0.76%), and Osage (1.8%, a difference of 0.79%). Similarly, the demographic groups most similar to Immigrants from Australia are Immigrants from Denmark (1.7%, a difference of 0.040%), Ukrainian (1.8%, a difference of 0.050%), Potawatomi (1.7%, a difference of 0.090%), Immigrants from South Africa (1.7%, a difference of 0.20%), and Icelander (1.7%, a difference of 0.29%).
| Demographics | Rating | Rank | No Schooling Completed |
| Immigrants | Sweden | 99.3 /100 | #77 | Exceptional 1.7% |
| Delaware | 99.3 /100 | #78 | Exceptional 1.7% |
| Macedonians | 99.3 /100 | #79 | Exceptional 1.7% |
| Cypriots | 99.3 /100 | #80 | Exceptional 1.7% |
| Icelanders | 99.3 /100 | #81 | Exceptional 1.7% |
| Immigrants | South Africa | 99.3 /100 | #82 | Exceptional 1.7% |
| Potawatomi | 99.3 /100 | #83 | Exceptional 1.7% |
| Immigrants | Denmark | 99.2 /100 | #84 | Exceptional 1.7% |
| Immigrants | Australia | 99.2 /100 | #85 | Exceptional 1.7% |
| Ukrainians | 99.2 /100 | #86 | Exceptional 1.8% |
| Osage | 99.2 /100 | #87 | Exceptional 1.8% |
| Immigrants | Western Europe | 99.2 /100 | #88 | Exceptional 1.8% |
| South Africans | 99.1 /100 | #89 | Exceptional 1.8% |
| Sioux | 99.0 /100 | #90 | Exceptional 1.8% |
| Immigrants | Germany | 99.0 /100 | #91 | Exceptional 1.8% |
| Romanians | 98.8 /100 | #92 | Exceptional 1.8% |
| Turks | 98.7 /100 | #93 | Exceptional 1.8% |
| Immigrants | Nonimmigrants | 98.5 /100 | #94 | Exceptional 1.8% |
| Puget Sound Salish | 98.5 /100 | #95 | Exceptional 1.8% |
| Bhutanese | 98.4 /100 | #96 | Exceptional 1.8% |
| Immigrants | Ireland | 98.4 /100 | #97 | Exceptional 1.8% |