Shoshone vs Immigrants from Ukraine Per Capita Income
COMPARE
Shoshone
Immigrants from Ukraine
Per Capita Income
Per Capita Income Comparison
Shoshone
Immigrants from Ukraine
$37,072
PER CAPITA INCOME
0.1/ 100
METRIC RATING
302nd/ 347
METRIC RANK
$48,134
PER CAPITA INCOME
99.3/ 100
METRIC RATING
84th/ 347
METRIC RANK
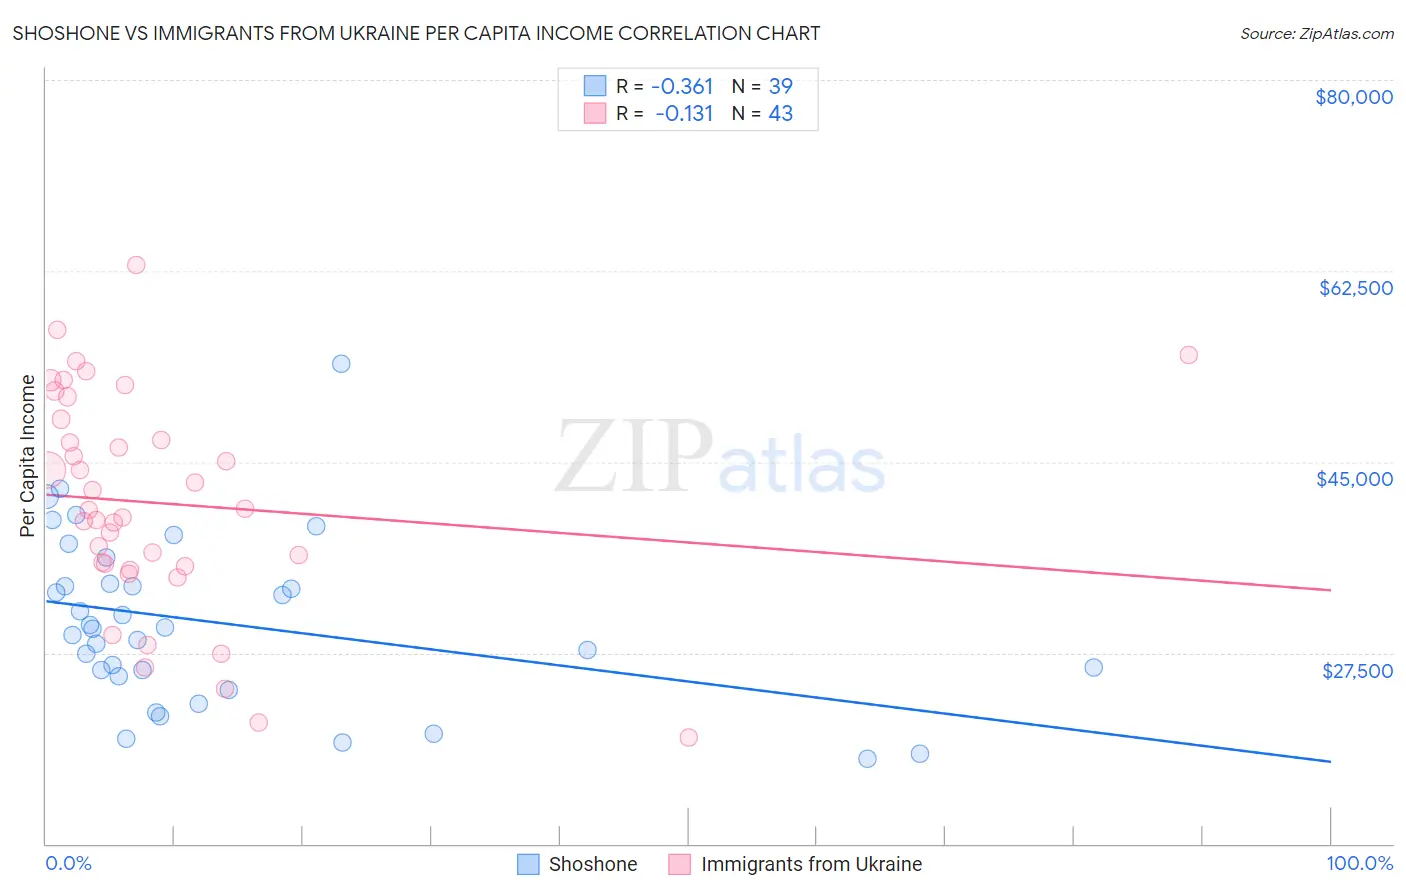
Shoshone vs Immigrants from Ukraine Per Capita Income Correlation Chart
The statistical analysis conducted on geographies consisting of 66,627,177 people shows a mild negative correlation between the proportion of Shoshone and per capita income in the United States with a correlation coefficient (R) of -0.361 and weighted average of $37,072. Similarly, the statistical analysis conducted on geographies consisting of 289,713,561 people shows a poor negative correlation between the proportion of Immigrants from Ukraine and per capita income in the United States with a correlation coefficient (R) of -0.131 and weighted average of $48,134, a difference of 29.8%.
Per Capita Income Correlation Summary
| Measurement | Shoshone | Immigrants from Ukraine |
| Minimum | $17,814 | $19,750 |
| Maximum | $54,019 | $63,043 |
| Range | $36,205 | $43,293 |
| Mean | $30,204 | $41,193 |
| Median | $29,691 | $40,580 |
| Interquartile 25% (IQ1) | $25,299 | $35,390 |
| Interquartile 75% (IQ3) | $33,868 | $48,903 |
| Interquartile Range (IQR) | $8,569 | $13,513 |
| Standard Deviation (Sample) | $7,800 | $9,996 |
| Standard Deviation (Population) | $7,700 | $9,879 |
Similar Demographics by Per Capita Income
Demographics Similar to Shoshone by Per Capita Income
In terms of per capita income, the demographic groups most similar to Shoshone are Paiute ($37,066, a difference of 0.020%), Ottawa ($37,101, a difference of 0.080%), Honduran ($37,031, a difference of 0.11%), Inupiat ($36,999, a difference of 0.20%), and Immigrants from Bahamas ($37,193, a difference of 0.33%).
| Demographics | Rating | Rank | Per Capita Income |
| Immigrants | Dominican Republic | 0.1 /100 | #295 | Tragic $37,306 |
| Indonesians | 0.1 /100 | #296 | Tragic $37,300 |
| Haitians | 0.1 /100 | #297 | Tragic $37,289 |
| Immigrants | Caribbean | 0.1 /100 | #298 | Tragic $37,254 |
| Cherokee | 0.1 /100 | #299 | Tragic $37,203 |
| Immigrants | Bahamas | 0.1 /100 | #300 | Tragic $37,193 |
| Ottawa | 0.1 /100 | #301 | Tragic $37,101 |
| Shoshone | 0.1 /100 | #302 | Tragic $37,072 |
| Paiute | 0.1 /100 | #303 | Tragic $37,066 |
| Hondurans | 0.1 /100 | #304 | Tragic $37,031 |
| Inupiat | 0.1 /100 | #305 | Tragic $36,999 |
| Immigrants | Haiti | 0.0 /100 | #306 | Tragic $36,849 |
| Immigrants | Latin America | 0.0 /100 | #307 | Tragic $36,823 |
| Fijians | 0.0 /100 | #308 | Tragic $36,690 |
| Immigrants | Honduras | 0.0 /100 | #309 | Tragic $36,665 |
Demographics Similar to Immigrants from Ukraine by Per Capita Income
In terms of per capita income, the demographic groups most similar to Immigrants from Ukraine are Austrian ($48,116, a difference of 0.040%), Immigrants from Brazil ($48,164, a difference of 0.060%), Immigrants from Indonesia ($48,195, a difference of 0.13%), Immigrants from Southern Europe ($48,027, a difference of 0.22%), and Ukrainian ($48,014, a difference of 0.25%).
| Demographics | Rating | Rank | Per Capita Income |
| Immigrants | Kazakhstan | 99.7 /100 | #77 | Exceptional $48,747 |
| Immigrants | Italy | 99.6 /100 | #78 | Exceptional $48,654 |
| Romanians | 99.5 /100 | #79 | Exceptional $48,445 |
| Egyptians | 99.5 /100 | #80 | Exceptional $48,358 |
| Armenians | 99.4 /100 | #81 | Exceptional $48,287 |
| Immigrants | Indonesia | 99.4 /100 | #82 | Exceptional $48,195 |
| Immigrants | Brazil | 99.4 /100 | #83 | Exceptional $48,164 |
| Immigrants | Ukraine | 99.3 /100 | #84 | Exceptional $48,134 |
| Austrians | 99.3 /100 | #85 | Exceptional $48,116 |
| Immigrants | Southern Europe | 99.3 /100 | #86 | Exceptional $48,027 |
| Ukrainians | 99.3 /100 | #87 | Exceptional $48,014 |
| Croatians | 99.0 /100 | #88 | Exceptional $47,742 |
| Northern Europeans | 98.9 /100 | #89 | Exceptional $47,698 |
| Italians | 98.8 /100 | #90 | Exceptional $47,574 |
| Macedonians | 98.8 /100 | #91 | Exceptional $47,573 |