British vs Immigrants from Ukraine Per Capita Income
COMPARE
British
Immigrants from Ukraine
Per Capita Income
Per Capita Income Comparison
British
Immigrants from Ukraine
$46,571
PER CAPITA INCOME
96.3/ 100
METRIC RATING
105th/ 347
METRIC RANK
$48,134
PER CAPITA INCOME
99.3/ 100
METRIC RATING
84th/ 347
METRIC RANK
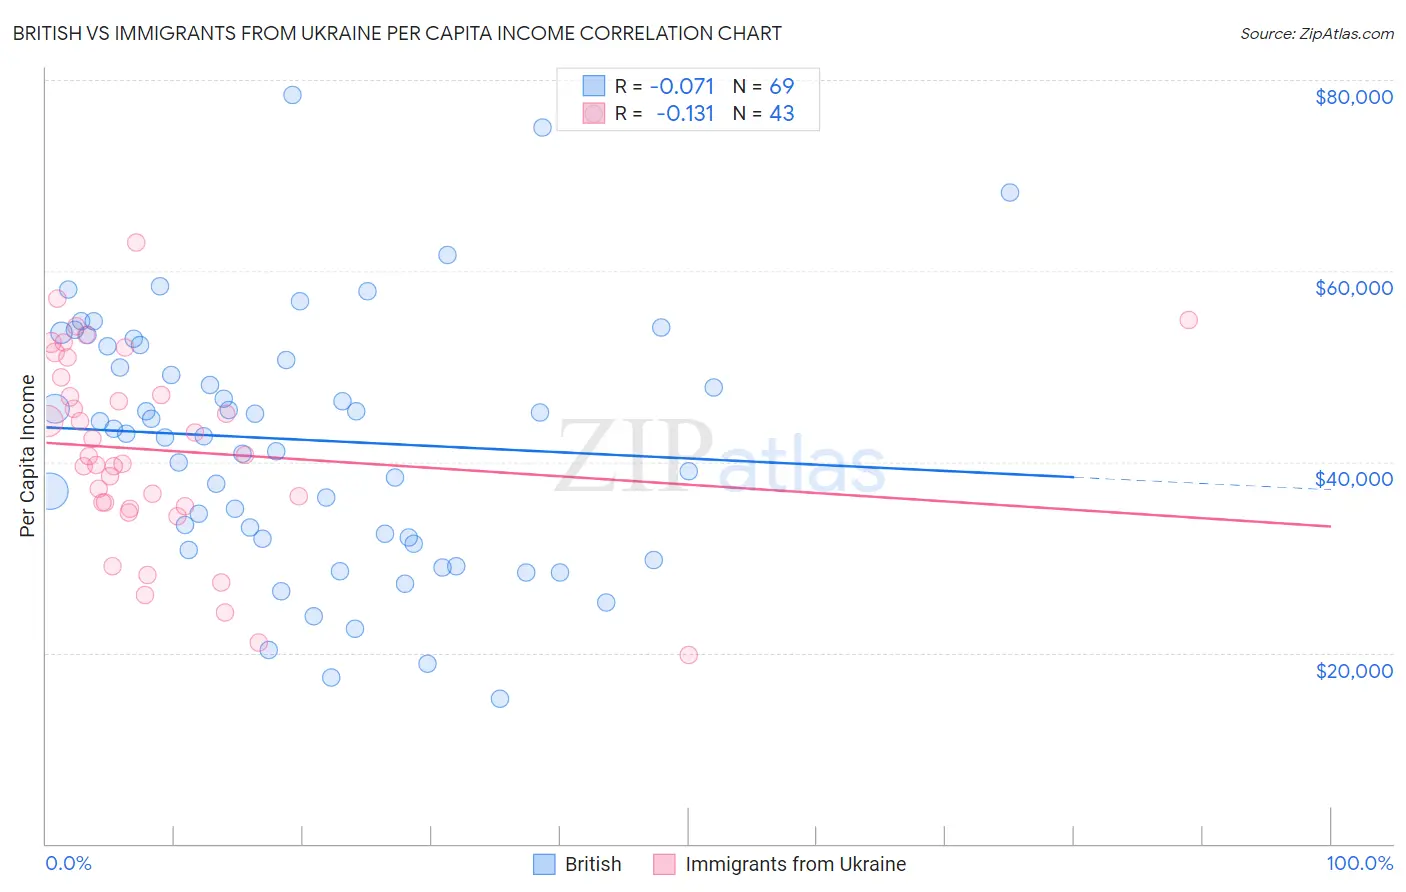
British vs Immigrants from Ukraine Per Capita Income Correlation Chart
The statistical analysis conducted on geographies consisting of 531,509,252 people shows a slight negative correlation between the proportion of British and per capita income in the United States with a correlation coefficient (R) of -0.071 and weighted average of $46,571. Similarly, the statistical analysis conducted on geographies consisting of 289,713,561 people shows a poor negative correlation between the proportion of Immigrants from Ukraine and per capita income in the United States with a correlation coefficient (R) of -0.131 and weighted average of $48,134, a difference of 3.4%.
Per Capita Income Correlation Summary
| Measurement | British | Immigrants from Ukraine |
| Minimum | $15,188 | $19,750 |
| Maximum | $78,420 | $63,043 |
| Range | $63,232 | $43,293 |
| Mean | $42,295 | $41,193 |
| Median | $42,961 | $40,580 |
| Interquartile 25% (IQ1) | $31,698 | $35,390 |
| Interquartile 75% (IQ3) | $52,162 | $48,903 |
| Interquartile Range (IQR) | $20,464 | $13,513 |
| Standard Deviation (Sample) | $13,799 | $9,996 |
| Standard Deviation (Population) | $13,699 | $9,879 |
Similar Demographics by Per Capita Income
Demographics Similar to British by Per Capita Income
In terms of per capita income, the demographic groups most similar to British are Ethiopian ($46,569, a difference of 0.0%), Serbian ($46,551, a difference of 0.040%), Immigrants from Kuwait ($46,543, a difference of 0.060%), Immigrants from Northern Africa ($46,531, a difference of 0.090%), and Chilean ($46,459, a difference of 0.24%).
| Demographics | Rating | Rank | Per Capita Income |
| Immigrants | Pakistan | 97.9 /100 | #98 | Exceptional $47,084 |
| Laotians | 97.8 /100 | #99 | Exceptional $47,041 |
| Immigrants | Lebanon | 97.5 /100 | #100 | Exceptional $46,938 |
| Immigrants | Uzbekistan | 97.5 /100 | #101 | Exceptional $46,929 |
| Immigrants | Western Asia | 97.4 /100 | #102 | Exceptional $46,876 |
| Syrians | 97.2 /100 | #103 | Exceptional $46,837 |
| Brazilians | 96.8 /100 | #104 | Exceptional $46,700 |
| British | 96.3 /100 | #105 | Exceptional $46,571 |
| Ethiopians | 96.3 /100 | #106 | Exceptional $46,569 |
| Serbians | 96.2 /100 | #107 | Exceptional $46,551 |
| Immigrants | Kuwait | 96.2 /100 | #108 | Exceptional $46,543 |
| Immigrants | Northern Africa | 96.2 /100 | #109 | Exceptional $46,531 |
| Chileans | 95.9 /100 | #110 | Exceptional $46,459 |
| Taiwanese | 95.8 /100 | #111 | Exceptional $46,455 |
| Immigrants | Morocco | 95.7 /100 | #112 | Exceptional $46,430 |
Demographics Similar to Immigrants from Ukraine by Per Capita Income
In terms of per capita income, the demographic groups most similar to Immigrants from Ukraine are Austrian ($48,116, a difference of 0.040%), Immigrants from Brazil ($48,164, a difference of 0.060%), Immigrants from Indonesia ($48,195, a difference of 0.13%), Immigrants from Southern Europe ($48,027, a difference of 0.22%), and Ukrainian ($48,014, a difference of 0.25%).
| Demographics | Rating | Rank | Per Capita Income |
| Immigrants | Kazakhstan | 99.7 /100 | #77 | Exceptional $48,747 |
| Immigrants | Italy | 99.6 /100 | #78 | Exceptional $48,654 |
| Romanians | 99.5 /100 | #79 | Exceptional $48,445 |
| Egyptians | 99.5 /100 | #80 | Exceptional $48,358 |
| Armenians | 99.4 /100 | #81 | Exceptional $48,287 |
| Immigrants | Indonesia | 99.4 /100 | #82 | Exceptional $48,195 |
| Immigrants | Brazil | 99.4 /100 | #83 | Exceptional $48,164 |
| Immigrants | Ukraine | 99.3 /100 | #84 | Exceptional $48,134 |
| Austrians | 99.3 /100 | #85 | Exceptional $48,116 |
| Immigrants | Southern Europe | 99.3 /100 | #86 | Exceptional $48,027 |
| Ukrainians | 99.3 /100 | #87 | Exceptional $48,014 |
| Croatians | 99.0 /100 | #88 | Exceptional $47,742 |
| Northern Europeans | 98.9 /100 | #89 | Exceptional $47,698 |
| Italians | 98.8 /100 | #90 | Exceptional $47,574 |
| Macedonians | 98.8 /100 | #91 | Exceptional $47,573 |