Austrian vs Immigrants from Ukraine Per Capita Income
COMPARE
Austrian
Immigrants from Ukraine
Per Capita Income
Per Capita Income Comparison
Austrians
Immigrants from Ukraine
$48,116
PER CAPITA INCOME
99.3/ 100
METRIC RATING
85th/ 347
METRIC RANK
$48,134
PER CAPITA INCOME
99.3/ 100
METRIC RATING
84th/ 347
METRIC RANK
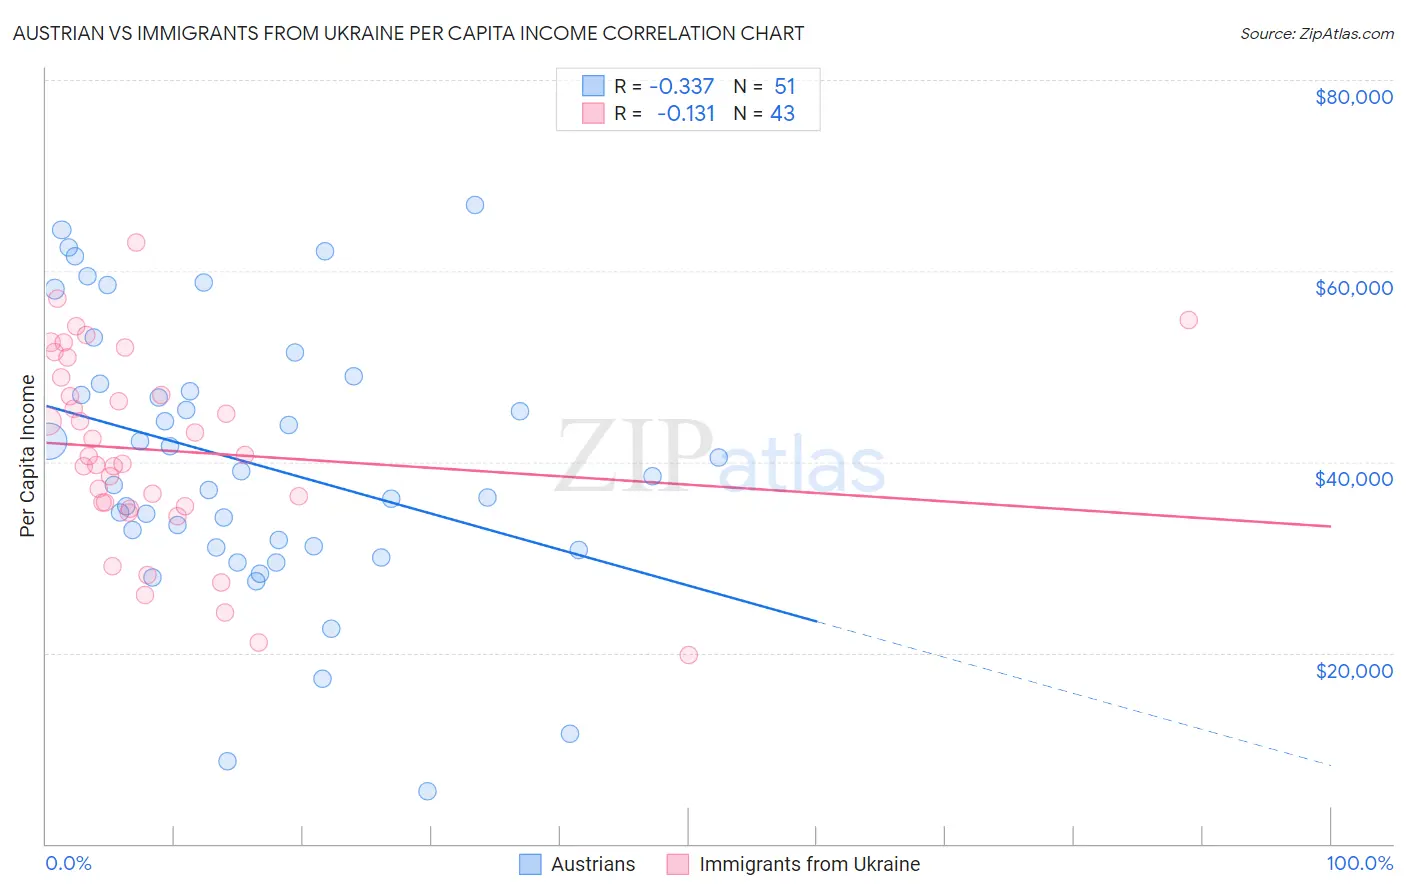
Austrian vs Immigrants from Ukraine Per Capita Income Correlation Chart
The statistical analysis conducted on geographies consisting of 452,103,489 people shows a mild negative correlation between the proportion of Austrians and per capita income in the United States with a correlation coefficient (R) of -0.337 and weighted average of $48,116. Similarly, the statistical analysis conducted on geographies consisting of 289,713,561 people shows a poor negative correlation between the proportion of Immigrants from Ukraine and per capita income in the United States with a correlation coefficient (R) of -0.131 and weighted average of $48,134, a difference of 0.040%.
Per Capita Income Correlation Summary
| Measurement | Austrian | Immigrants from Ukraine |
| Minimum | $5,500 | $19,750 |
| Maximum | $66,908 | $63,043 |
| Range | $61,408 | $43,293 |
| Mean | $39,852 | $41,193 |
| Median | $38,439 | $40,580 |
| Interquartile 25% (IQ1) | $31,067 | $35,390 |
| Interquartile 75% (IQ3) | $48,128 | $48,903 |
| Interquartile Range (IQR) | $17,061 | $13,513 |
| Standard Deviation (Sample) | $14,137 | $9,996 |
| Standard Deviation (Population) | $13,998 | $9,879 |
Demographics Similar to Austrians and Immigrants from Ukraine by Per Capita Income
In terms of per capita income, the demographic groups most similar to Austrians are Immigrants from Brazil ($48,164, a difference of 0.10%), Immigrants from Indonesia ($48,195, a difference of 0.16%), Immigrants from Southern Europe ($48,027, a difference of 0.18%), Ukrainian ($48,014, a difference of 0.21%), and Armenian ($48,287, a difference of 0.36%). Similarly, the demographic groups most similar to Immigrants from Ukraine are Immigrants from Brazil ($48,164, a difference of 0.060%), Immigrants from Indonesia ($48,195, a difference of 0.13%), Immigrants from Southern Europe ($48,027, a difference of 0.22%), Ukrainian ($48,014, a difference of 0.25%), and Armenian ($48,287, a difference of 0.32%).
| Demographics | Rating | Rank | Per Capita Income |
| Mongolians | 99.8 /100 | #74 | Exceptional $49,173 |
| Immigrants | Bolivia | 99.7 /100 | #75 | Exceptional $48,970 |
| Immigrants | England | 99.7 /100 | #76 | Exceptional $48,844 |
| Immigrants | Kazakhstan | 99.7 /100 | #77 | Exceptional $48,747 |
| Immigrants | Italy | 99.6 /100 | #78 | Exceptional $48,654 |
| Romanians | 99.5 /100 | #79 | Exceptional $48,445 |
| Egyptians | 99.5 /100 | #80 | Exceptional $48,358 |
| Armenians | 99.4 /100 | #81 | Exceptional $48,287 |
| Immigrants | Indonesia | 99.4 /100 | #82 | Exceptional $48,195 |
| Immigrants | Brazil | 99.4 /100 | #83 | Exceptional $48,164 |
| Immigrants | Ukraine | 99.3 /100 | #84 | Exceptional $48,134 |
| Austrians | 99.3 /100 | #85 | Exceptional $48,116 |
| Immigrants | Southern Europe | 99.3 /100 | #86 | Exceptional $48,027 |
| Ukrainians | 99.3 /100 | #87 | Exceptional $48,014 |
| Croatians | 99.0 /100 | #88 | Exceptional $47,742 |
| Northern Europeans | 98.9 /100 | #89 | Exceptional $47,698 |
| Italians | 98.8 /100 | #90 | Exceptional $47,574 |
| Macedonians | 98.8 /100 | #91 | Exceptional $47,573 |
| Immigrants | Moldova | 98.7 /100 | #92 | Exceptional $47,489 |
| Immigrants | Zimbabwe | 98.5 /100 | #93 | Exceptional $47,394 |
| Albanians | 98.5 /100 | #94 | Exceptional $47,379 |