Brazilian vs Immigrants from Ukraine Per Capita Income
COMPARE
Brazilian
Immigrants from Ukraine
Per Capita Income
Per Capita Income Comparison
Brazilians
Immigrants from Ukraine
$46,700
PER CAPITA INCOME
96.8/ 100
METRIC RATING
104th/ 347
METRIC RANK
$48,134
PER CAPITA INCOME
99.3/ 100
METRIC RATING
84th/ 347
METRIC RANK
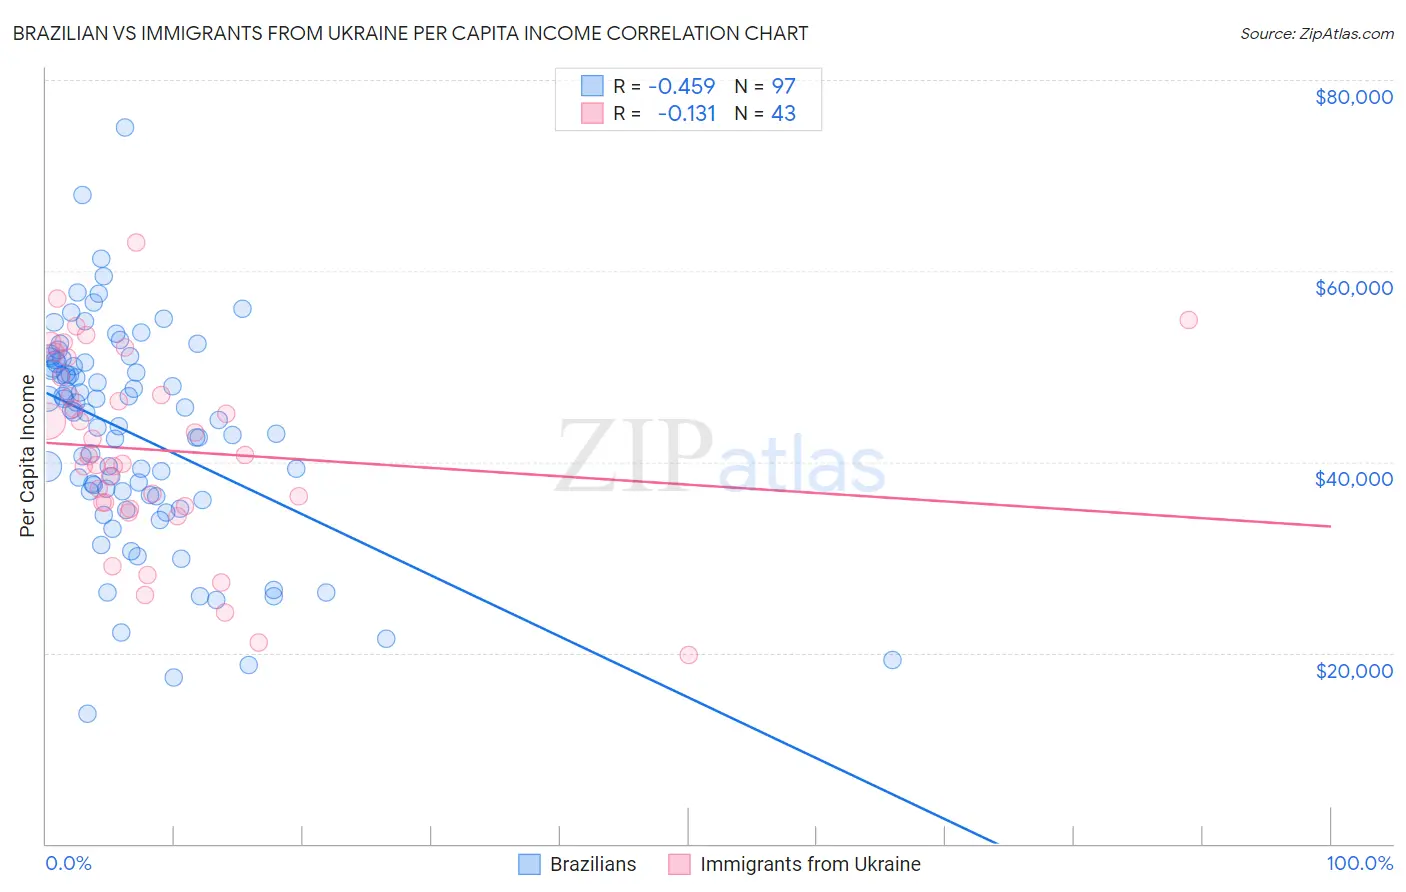
Brazilian vs Immigrants from Ukraine Per Capita Income Correlation Chart
The statistical analysis conducted on geographies consisting of 323,990,504 people shows a moderate negative correlation between the proportion of Brazilians and per capita income in the United States with a correlation coefficient (R) of -0.459 and weighted average of $46,700. Similarly, the statistical analysis conducted on geographies consisting of 289,713,561 people shows a poor negative correlation between the proportion of Immigrants from Ukraine and per capita income in the United States with a correlation coefficient (R) of -0.131 and weighted average of $48,134, a difference of 3.1%.
Per Capita Income Correlation Summary
| Measurement | Brazilian | Immigrants from Ukraine |
| Minimum | $13,624 | $19,750 |
| Maximum | $75,068 | $63,043 |
| Range | $61,444 | $43,293 |
| Mean | $42,865 | $41,193 |
| Median | $45,205 | $40,580 |
| Interquartile 25% (IQ1) | $36,434 | $35,390 |
| Interquartile 75% (IQ3) | $50,401 | $48,903 |
| Interquartile Range (IQR) | $13,966 | $13,513 |
| Standard Deviation (Sample) | $11,177 | $9,996 |
| Standard Deviation (Population) | $11,120 | $9,879 |
Demographics Similar to Brazilians and Immigrants from Ukraine by Per Capita Income
In terms of per capita income, the demographic groups most similar to Brazilians are Syrian ($46,837, a difference of 0.29%), Immigrants from Western Asia ($46,876, a difference of 0.38%), Immigrants from Uzbekistan ($46,929, a difference of 0.49%), Immigrants from Lebanon ($46,938, a difference of 0.51%), and Laotian ($47,041, a difference of 0.73%). Similarly, the demographic groups most similar to Immigrants from Ukraine are Austrian ($48,116, a difference of 0.040%), Immigrants from Southern Europe ($48,027, a difference of 0.22%), Ukrainian ($48,014, a difference of 0.25%), Croatian ($47,742, a difference of 0.82%), and Northern European ($47,698, a difference of 0.91%).
| Demographics | Rating | Rank | Per Capita Income |
| Immigrants | Ukraine | 99.3 /100 | #84 | Exceptional $48,134 |
| Austrians | 99.3 /100 | #85 | Exceptional $48,116 |
| Immigrants | Southern Europe | 99.3 /100 | #86 | Exceptional $48,027 |
| Ukrainians | 99.3 /100 | #87 | Exceptional $48,014 |
| Croatians | 99.0 /100 | #88 | Exceptional $47,742 |
| Northern Europeans | 98.9 /100 | #89 | Exceptional $47,698 |
| Italians | 98.8 /100 | #90 | Exceptional $47,574 |
| Macedonians | 98.8 /100 | #91 | Exceptional $47,573 |
| Immigrants | Moldova | 98.7 /100 | #92 | Exceptional $47,489 |
| Immigrants | Zimbabwe | 98.5 /100 | #93 | Exceptional $47,394 |
| Albanians | 98.5 /100 | #94 | Exceptional $47,379 |
| Immigrants | Egypt | 98.5 /100 | #95 | Exceptional $47,361 |
| Alsatians | 98.3 /100 | #96 | Exceptional $47,284 |
| Carpatho Rusyns | 98.2 /100 | #97 | Exceptional $47,248 |
| Immigrants | Pakistan | 97.9 /100 | #98 | Exceptional $47,084 |
| Laotians | 97.8 /100 | #99 | Exceptional $47,041 |
| Immigrants | Lebanon | 97.5 /100 | #100 | Exceptional $46,938 |
| Immigrants | Uzbekistan | 97.5 /100 | #101 | Exceptional $46,929 |
| Immigrants | Western Asia | 97.4 /100 | #102 | Exceptional $46,876 |
| Syrians | 97.2 /100 | #103 | Exceptional $46,837 |
| Brazilians | 96.8 /100 | #104 | Exceptional $46,700 |