Shoshone vs Immigrants from Europe Per Capita Income
COMPARE
Shoshone
Immigrants from Europe
Per Capita Income
Per Capita Income Comparison
Shoshone
Immigrants from Europe
$37,072
PER CAPITA INCOME
0.1/ 100
METRIC RATING
302nd/ 347
METRIC RANK
$50,950
PER CAPITA INCOME
100.0/ 100
METRIC RATING
44th/ 347
METRIC RANK
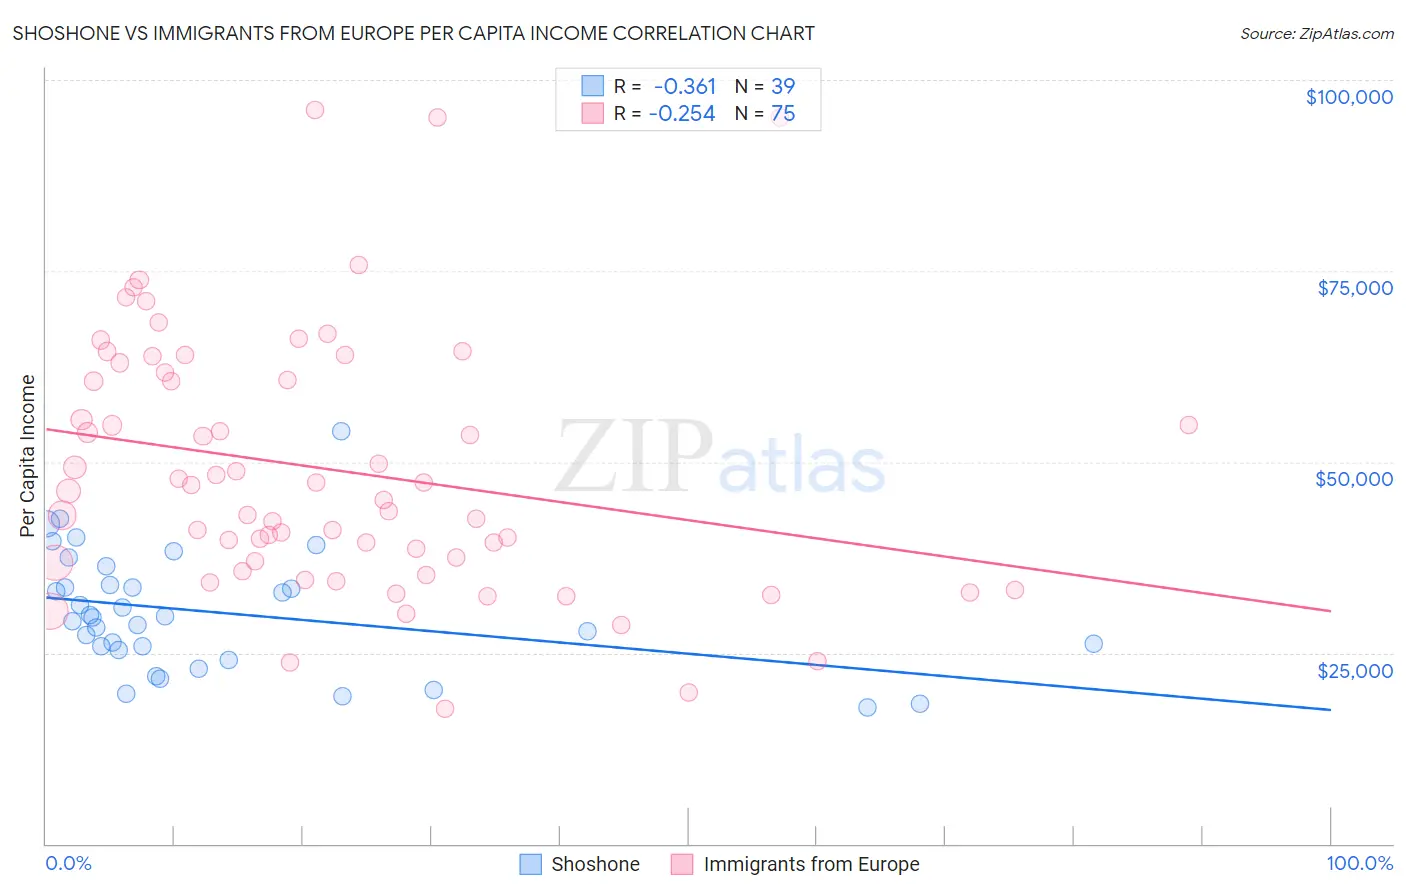
Shoshone vs Immigrants from Europe Per Capita Income Correlation Chart
The statistical analysis conducted on geographies consisting of 66,627,177 people shows a mild negative correlation between the proportion of Shoshone and per capita income in the United States with a correlation coefficient (R) of -0.361 and weighted average of $37,072. Similarly, the statistical analysis conducted on geographies consisting of 547,472,676 people shows a weak negative correlation between the proportion of Immigrants from Europe and per capita income in the United States with a correlation coefficient (R) of -0.254 and weighted average of $50,950, a difference of 37.4%.
Per Capita Income Correlation Summary
| Measurement | Shoshone | Immigrants from Europe |
| Minimum | $17,814 | $17,669 |
| Maximum | $54,019 | $96,014 |
| Range | $36,205 | $78,345 |
| Mean | $30,204 | $48,981 |
| Median | $29,691 | $46,157 |
| Interquartile 25% (IQ1) | $25,299 | $36,802 |
| Interquartile 75% (IQ3) | $33,868 | $61,703 |
| Interquartile Range (IQR) | $8,569 | $24,901 |
| Standard Deviation (Sample) | $7,800 | $16,839 |
| Standard Deviation (Population) | $7,700 | $16,727 |
Similar Demographics by Per Capita Income
Demographics Similar to Shoshone by Per Capita Income
In terms of per capita income, the demographic groups most similar to Shoshone are Paiute ($37,066, a difference of 0.020%), Ottawa ($37,101, a difference of 0.080%), Honduran ($37,031, a difference of 0.11%), Inupiat ($36,999, a difference of 0.20%), and Immigrants from Bahamas ($37,193, a difference of 0.33%).
| Demographics | Rating | Rank | Per Capita Income |
| Immigrants | Dominican Republic | 0.1 /100 | #295 | Tragic $37,306 |
| Indonesians | 0.1 /100 | #296 | Tragic $37,300 |
| Haitians | 0.1 /100 | #297 | Tragic $37,289 |
| Immigrants | Caribbean | 0.1 /100 | #298 | Tragic $37,254 |
| Cherokee | 0.1 /100 | #299 | Tragic $37,203 |
| Immigrants | Bahamas | 0.1 /100 | #300 | Tragic $37,193 |
| Ottawa | 0.1 /100 | #301 | Tragic $37,101 |
| Shoshone | 0.1 /100 | #302 | Tragic $37,072 |
| Paiute | 0.1 /100 | #303 | Tragic $37,066 |
| Hondurans | 0.1 /100 | #304 | Tragic $37,031 |
| Inupiat | 0.1 /100 | #305 | Tragic $36,999 |
| Immigrants | Haiti | 0.0 /100 | #306 | Tragic $36,849 |
| Immigrants | Latin America | 0.0 /100 | #307 | Tragic $36,823 |
| Fijians | 0.0 /100 | #308 | Tragic $36,690 |
| Immigrants | Honduras | 0.0 /100 | #309 | Tragic $36,665 |
Demographics Similar to Immigrants from Europe by Per Capita Income
In terms of per capita income, the demographic groups most similar to Immigrants from Europe are Immigrants from Spain ($50,933, a difference of 0.030%), Immigrants from Latvia ($50,914, a difference of 0.070%), Bulgarian ($50,906, a difference of 0.090%), Immigrants from Serbia ($50,810, a difference of 0.28%), and New Zealander ($50,575, a difference of 0.74%).
| Demographics | Rating | Rank | Per Capita Income |
| Estonians | 100.0 /100 | #37 | Exceptional $51,875 |
| Immigrants | Czechoslovakia | 100.0 /100 | #38 | Exceptional $51,770 |
| Cambodians | 100.0 /100 | #39 | Exceptional $51,731 |
| Immigrants | Korea | 100.0 /100 | #40 | Exceptional $51,671 |
| Immigrants | South Africa | 100.0 /100 | #41 | Exceptional $51,465 |
| Immigrants | Turkey | 100.0 /100 | #42 | Exceptional $51,368 |
| Immigrants | Lithuania | 100.0 /100 | #43 | Exceptional $51,361 |
| Immigrants | Europe | 100.0 /100 | #44 | Exceptional $50,950 |
| Immigrants | Spain | 100.0 /100 | #45 | Exceptional $50,933 |
| Immigrants | Latvia | 100.0 /100 | #46 | Exceptional $50,914 |
| Bulgarians | 100.0 /100 | #47 | Exceptional $50,906 |
| Immigrants | Serbia | 100.0 /100 | #48 | Exceptional $50,810 |
| New Zealanders | 100.0 /100 | #49 | Exceptional $50,575 |
| Immigrants | Sri Lanka | 100.0 /100 | #50 | Exceptional $50,555 |
| Immigrants | Netherlands | 100.0 /100 | #51 | Exceptional $50,458 |