Senegalese vs Immigrants from Argentina 8th Grade
COMPARE
Senegalese
Immigrants from Argentina
8th Grade
8th Grade Comparison
Senegalese
Immigrants from Argentina
95.2%
8TH GRADE
2.7/ 100
METRIC RATING
236th/ 347
METRIC RANK
95.5%
8TH GRADE
20.6/ 100
METRIC RATING
201st/ 347
METRIC RANK
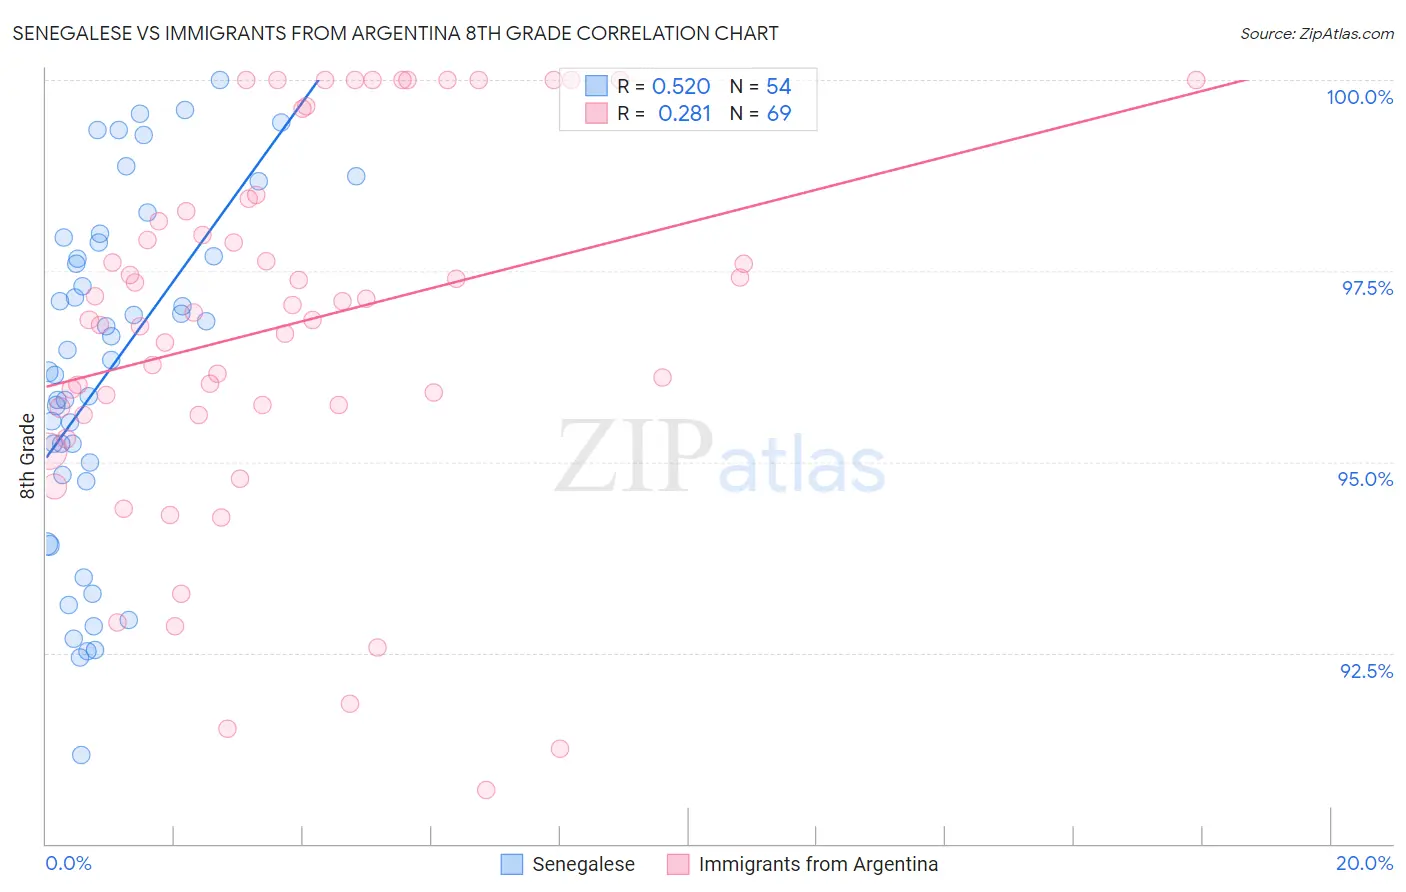
Senegalese vs Immigrants from Argentina 8th Grade Correlation Chart
The statistical analysis conducted on geographies consisting of 78,142,569 people shows a substantial positive correlation between the proportion of Senegalese and percentage of population with at least 8th grade education in the United States with a correlation coefficient (R) of 0.520 and weighted average of 95.2%. Similarly, the statistical analysis conducted on geographies consisting of 264,437,906 people shows a weak positive correlation between the proportion of Immigrants from Argentina and percentage of population with at least 8th grade education in the United States with a correlation coefficient (R) of 0.281 and weighted average of 95.5%, a difference of 0.36%.
8th Grade Correlation Summary
| Measurement | Senegalese | Immigrants from Argentina |
| Minimum | 91.2% | 90.7% |
| Maximum | 100.0% | 100.0% |
| Range | 8.8% | 9.3% |
| Mean | 96.2% | 96.8% |
| Median | 96.4% | 97.0% |
| Interquartile 25% (IQ1) | 94.8% | 95.7% |
| Interquartile 75% (IQ3) | 97.9% | 98.4% |
| Interquartile Range (IQR) | 3.0% | 2.7% |
| Standard Deviation (Sample) | 2.3% | 2.4% |
| Standard Deviation (Population) | 2.2% | 2.4% |
Similar Demographics by 8th Grade
Demographics Similar to Senegalese by 8th Grade
In terms of 8th grade, the demographic groups most similar to Senegalese are Immigrants from Africa (95.2%, a difference of 0.0%), Nigerian (95.2%, a difference of 0.010%), Immigrants from Asia (95.2%, a difference of 0.020%), Costa Rican (95.2%, a difference of 0.020%), and Indian (Asian) (95.2%, a difference of 0.030%).
| Demographics | Rating | Rank | 8th Grade |
| Immigrants | Indonesia | 4.4 /100 | #229 | Tragic 95.3% |
| Immigrants | Panama | 4.1 /100 | #230 | Tragic 95.2% |
| Asians | 3.5 /100 | #231 | Tragic 95.2% |
| Indians (Asian) | 3.3 /100 | #232 | Tragic 95.2% |
| Immigrants | Asia | 3.1 /100 | #233 | Tragic 95.2% |
| Costa Ricans | 3.0 /100 | #234 | Tragic 95.2% |
| Nigerians | 2.9 /100 | #235 | Tragic 95.2% |
| Senegalese | 2.7 /100 | #236 | Tragic 95.2% |
| Immigrants | Africa | 2.7 /100 | #237 | Tragic 95.2% |
| Natives/Alaskans | 2.3 /100 | #238 | Tragic 95.2% |
| Immigrants | Sierra Leone | 2.1 /100 | #239 | Tragic 95.1% |
| Ethiopians | 2.0 /100 | #240 | Tragic 95.1% |
| South American Indians | 1.9 /100 | #241 | Tragic 95.1% |
| Tongans | 1.7 /100 | #242 | Tragic 95.1% |
| Paiute | 1.7 /100 | #243 | Tragic 95.1% |
Demographics Similar to Immigrants from Argentina by 8th Grade
In terms of 8th grade, the demographic groups most similar to Immigrants from Argentina are Apache (95.5%, a difference of 0.010%), Paraguayan (95.5%, a difference of 0.020%), Immigrants from Northern Africa (95.5%, a difference of 0.020%), Argentinean (95.5%, a difference of 0.020%), and Sierra Leonean (95.6%, a difference of 0.030%).
| Demographics | Rating | Rank | 8th Grade |
| Guamanians/Chamorros | 26.6 /100 | #194 | Fair 95.6% |
| Immigrants | Zaire | 25.2 /100 | #195 | Fair 95.6% |
| Assyrians/Chaldeans/Syriacs | 24.5 /100 | #196 | Fair 95.6% |
| Sierra Leoneans | 24.3 /100 | #197 | Fair 95.6% |
| Paraguayans | 22.6 /100 | #198 | Fair 95.5% |
| Immigrants | Northern Africa | 22.5 /100 | #199 | Fair 95.5% |
| Argentineans | 22.2 /100 | #200 | Fair 95.5% |
| Immigrants | Argentina | 20.6 /100 | #201 | Fair 95.5% |
| Apache | 19.4 /100 | #202 | Poor 95.5% |
| Moroccans | 17.4 /100 | #203 | Poor 95.5% |
| Hawaiians | 16.7 /100 | #204 | Poor 95.5% |
| Immigrants | Bahamas | 16.7 /100 | #205 | Poor 95.5% |
| Comanche | 16.3 /100 | #206 | Poor 95.5% |
| Immigrants | Sudan | 15.1 /100 | #207 | Poor 95.5% |
| Portuguese | 14.3 /100 | #208 | Poor 95.5% |